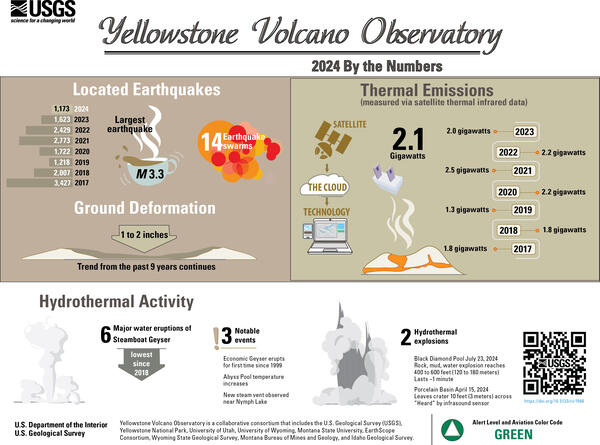
Infographic giving earthquake, deformation, thermal emission, and geyser statistics for the Yellowstone region for the year 2024
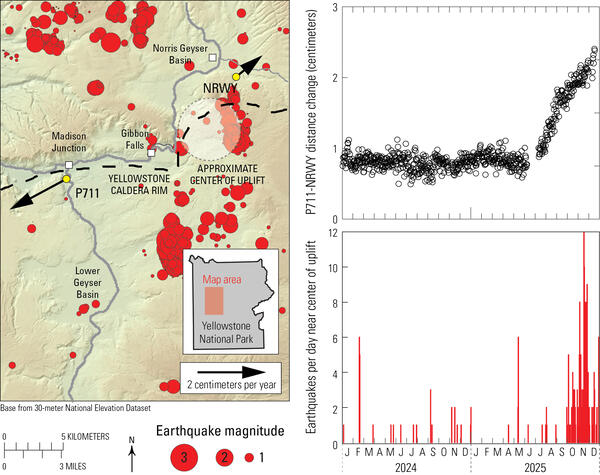
Infographic giving earthquake, deformation, thermal emission, and geyser statistics for the Yellowstone region for the year 2024Infographic giving earthquake, deformation, thermal emission, and geyser statistics for the Yellowstone region for the year 2024. The graphic accompanies the Yellowstone Volcano Observatory 2024 annual report, freely available online at https://pubs.usgs.gov/publication/cir1566.