
Abstract figures seem to appear on these South American plateaus. It is reminiscent of Southwestern artistic style with a modernist abstract twist. These farm fields are on the tops of plateaus in northeastern Brazil. Where the edges of the fields are ragged lines, the fields have been planted right up to the edge of cliffs.
Images
Peruse our selection of remote sensing and Earth science imagery below.
Filter Total Items: 871

Southwestern Abstract
Abstract figures seem to appear on these South American plateaus. It is reminiscent of Southwestern artistic style with a modernist abstract twist. These farm fields are on the tops of plateaus in northeastern Brazil. Where the edges of the fields are ragged lines, the fields have been planted right up to the edge of cliffs.

Mezen Mixing
In northern Russia, the freshwater of the Mezen River meets the saltwater of the Arctic Ocean. The funnel-shaped estuary has a strong tidal current that mixes sediment in the water rather than building up a delta. In this colorful composition, the increasing brightness marks an increase in water turbidity
In northern Russia, the freshwater of the Mezen River meets the saltwater of the Arctic Ocean. The funnel-shaped estuary has a strong tidal current that mixes sediment in the water rather than building up a delta. In this colorful composition, the increasing brightness marks an increase in water turbidity

A Study in Color
The deep purple in the lower right spreads out into a few channels before fading into a multitude of colors. These channels are remnants of an ancient drainage network in Kenya. The beauty of the colors actually hides a stark reality for hundreds of thousands of people. The dark spots at the top center of the image are refugee camps.
The deep purple in the lower right spreads out into a few channels before fading into a multitude of colors. These channels are remnants of an ancient drainage network in Kenya. The beauty of the colors actually hides a stark reality for hundreds of thousands of people. The dark spots at the top center of the image are refugee camps.

Cellular Ice
The ice surrounding the northern Canadian Spicer Islands, shown in bright red, resembles a cell, complete with ribosomes, mitochondria, and a nucleus. Even though the image was captured shortly after the first day of summer in the Northern Hemisphere, the islands are locked in ice.
The ice surrounding the northern Canadian Spicer Islands, shown in bright red, resembles a cell, complete with ribosomes, mitochondria, and a nucleus. Even though the image was captured shortly after the first day of summer in the Northern Hemisphere, the islands are locked in ice.

Petermann Glacier
Located on the northwestern coast of Greenland, Petermann Glacier covers 1,295 square kilometers (500 square miles). The glacier's floating tongue of ice extends from the lower right corner of the image toward the top center. At 15–20 kilometers (9–12 miles) wide and 70 kilometers (43 miles) long, it is the longest floating glacier in the Northern Hemisphere.
Located on the northwestern coast of Greenland, Petermann Glacier covers 1,295 square kilometers (500 square miles). The glacier's floating tongue of ice extends from the lower right corner of the image toward the top center. At 15–20 kilometers (9–12 miles) wide and 70 kilometers (43 miles) long, it is the longest floating glacier in the Northern Hemisphere.

Wind Power
A bold paint stroke on a busy purple canvas is actually part of the Dasht-e Lut Desert in southeastern Iran. The linear features are kaluts, huge rocky formations shaped by wind erosion. The streamlined forms vary in size, but some kaluts stretch more than 100 kilometers (62 miles).
A bold paint stroke on a busy purple canvas is actually part of the Dasht-e Lut Desert in southeastern Iran. The linear features are kaluts, huge rocky formations shaped by wind erosion. The streamlined forms vary in size, but some kaluts stretch more than 100 kilometers (62 miles).

Ink Stain
Like blue ink bleeding onto parchment, the Khor Kalmat lagoon branches off the Arabian Sea and spills into the southern Pakistan landscape near the Makran Coast Range. Mudflats cover almost the entire lagoon, which fills with shallow water at high tides. The small areas of green are isolated pockets of mangrove forest.
Like blue ink bleeding onto parchment, the Khor Kalmat lagoon branches off the Arabian Sea and spills into the southern Pakistan landscape near the Makran Coast Range. Mudflats cover almost the entire lagoon, which fills with shallow water at high tides. The small areas of green are isolated pockets of mangrove forest.

Mount Taranaki
A nearly perfect circle of forest delineates the boundary of Egmont National Park in New Zealand. Snow-capped Mount Taranaki marks the center of the park, which is surrounded by green farmland.
A nearly perfect circle of forest delineates the boundary of Egmont National Park in New Zealand. Snow-capped Mount Taranaki marks the center of the park, which is surrounded by green farmland.

Copper and Blue
The copper color in this infrared combination is the presence of lake ice in the Northwest Territories in northern Canada. The lake on the right side is Whitefish Lake, in a region with numerous glacial landforms. Bright wrinkle-like lines are eskers, ridges made of sand and gravel formed by glacial sediments deposited by meltwater rivers flowing on the ice.
The copper color in this infrared combination is the presence of lake ice in the Northwest Territories in northern Canada. The lake on the right side is Whitefish Lake, in a region with numerous glacial landforms. Bright wrinkle-like lines are eskers, ridges made of sand and gravel formed by glacial sediments deposited by meltwater rivers flowing on the ice.

The Lorian Swamp
Water flowing out of this inland delta rarely reaches the ocean; instead, it seeps into the semiarid plains of northeastern Kenya. The dark feature in the upper left, which looks like a black eye, is hard basaltic rock from an ancient lava flow.
Water flowing out of this inland delta rarely reaches the ocean; instead, it seeps into the semiarid plains of northeastern Kenya. The dark feature in the upper left, which looks like a black eye, is hard basaltic rock from an ancient lava flow.

River and Ridge
The Susquehanna River appears as a dark line coursing through this scene in southeastern Pennsylvania. The cities of York, Lancaster, and Reading lie among agricultural lands. The State capital, Harrisburg, is positioned against the orange folds in the upper left of the image, along the edge of the Appalachian Mountain Ridge and Valley Province.
The Susquehanna River appears as a dark line coursing through this scene in southeastern Pennsylvania. The cities of York, Lancaster, and Reading lie among agricultural lands. The State capital, Harrisburg, is positioned against the orange folds in the upper left of the image, along the edge of the Appalachian Mountain Ridge and Valley Province.

Salty Desolation
A vast, open expanse in Namibia is one of the largest salt pans in the world. The pan is within Etosha National Park, protected since 1907. The horizontal line across the image is the national park fence. The wild patterns in this infrared interpretation are from numerous episodes of water evaporation following seasonal rains.
A vast, open expanse in Namibia is one of the largest salt pans in the world. The pan is within Etosha National Park, protected since 1907. The horizontal line across the image is the national park fence. The wild patterns in this infrared interpretation are from numerous episodes of water evaporation following seasonal rains.

Eerie Cloud Shadows
These cloud patterns cast eerie shadows on the landscape of southern Egypt. The clouds appear red and the desert below hazy blue in this infrared rendition.
These cloud patterns cast eerie shadows on the landscape of southern Egypt. The clouds appear red and the desert below hazy blue in this infrared rendition.

Etched in Snow
Is this a black-and-white image? No, this is a natural color image of snow-covered southwestern Russia. Windbreaks, roads, and fence lines look like random pencil marks near the Volga River, which flows across the top of the image.
Is this a black-and-white image? No, this is a natural color image of snow-covered southwestern Russia. Windbreaks, roads, and fence lines look like random pencil marks near the Volga River, which flows across the top of the image.

Capillaries
Marking part of the boundary between Colombia and Venezuela, the Meta River resembles an artery among capillaries within the human body. Those capillary-like features actually depict dense tree cover along the numerous streams that flow among rich tropical grassland.
Marking part of the boundary between Colombia and Venezuela, the Meta River resembles an artery among capillaries within the human body. Those capillary-like features actually depict dense tree cover along the numerous streams that flow among rich tropical grassland.

Map showing agricultural expansion West Africa
Agriculture expansion between 1975 and 2013 and bioclimatic zones of West Africa (includes rainfed agriculture, irrigated agriculture, plantations, agriculture in shallows and recession, and cropland and fallow with oil palms)
Agriculture expansion between 1975 and 2013 and bioclimatic zones of West Africa (includes rainfed agriculture, irrigated agriculture, plantations, agriculture in shallows and recession, and cropland and fallow with oil palms)

West-central Mississippi land cover map derived from 2013 Landsat imag
West-central Mississippi land cover map derived from 2013 Landsat imagThis color-coded land cover map, showing cropland, water bodies, urban areas, and other types of land cover, is based on a 2013 Landsat satellite image. Satellite-image-derived land cover maps are essential tools for studying land cover and land use change over time on local, regional, and global scales.

Nevada Landsat State Mosaic
Nevada was the fastest growing state between 1990 and 2000, with a population growth rate of 66.3 percent. No other state topped 40 percent.
Capital Carson City
Image Source Landsat 8
Population 3,104,614
Number of Pixels 318,192,547
Nevada was the fastest growing state between 1990 and 2000, with a population growth rate of 66.3 percent. No other state topped 40 percent.
Capital Carson City
Image Source Landsat 8
Population 3,104,614
Number of Pixels 318,192,547

Koettlitz Glacier
Landsat 8 helps reveal the hidden complexities of the Antarctic landscape. In this image, ice takes on different levels of blue with exposed rock and dirt appearing in yellow tones. The dynamic Koettlitz Glacier flows between Brown Peninsula and the rugged mainland.
Landsat 8 helps reveal the hidden complexities of the Antarctic landscape. In this image, ice takes on different levels of blue with exposed rock and dirt appearing in yellow tones. The dynamic Koettlitz Glacier flows between Brown Peninsula and the rugged mainland.
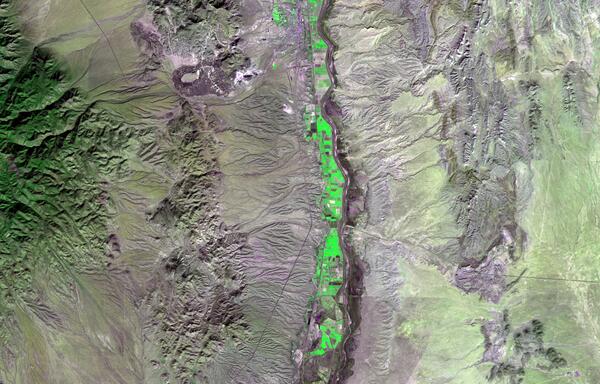
ASTER image of the Rio Grande River Valley
ASTER Surface Reflectance (AST_07) data can be used to view complex landscapes like the Rio Grande River Valley in southern New Mexico. This Terra ASTER surface reflectance natural color composite shows differences in reflectance over forested hills, irrigated agriculture, and arid regions.
ASTER Surface Reflectance (AST_07) data can be used to view complex landscapes like the Rio Grande River Valley in southern New Mexico. This Terra ASTER surface reflectance natural color composite shows differences in reflectance over forested hills, irrigated agriculture, and arid regions.

Rock Folding
This Landsat image shows how glaciers scoured the landscape, gouging out depressions that formed linear lakes. The glaciers also exposed the complex folded rock layers that form the Labrador Trough of Quebec in Canada. Glacial action is evident in the fingerprint-like patterns.
This Landsat image shows how glaciers scoured the landscape, gouging out depressions that formed linear lakes. The glaciers also exposed the complex folded rock layers that form the Labrador Trough of Quebec in Canada. Glacial action is evident in the fingerprint-like patterns.