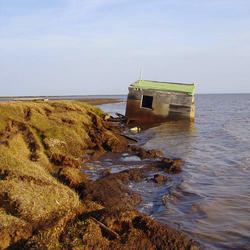


When a major storm is forecasted to affect the Delmarva region, up-to-date information is vital for the response.
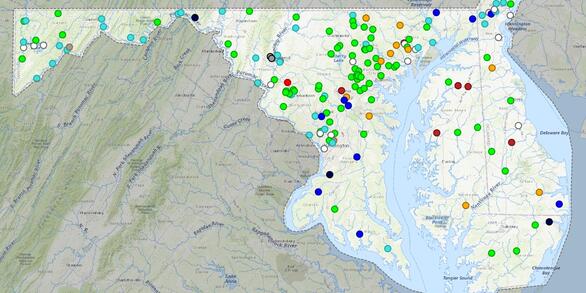
That’s when USGS crews spring into action, setting up rapid deployment gages that provide additional surge, wave, and tide hydrodynamics (SWaTH) data that augments our existing streamgage network.