
The USGS uses a variety of survey tools—including personal watercraft (jet skis) equipped with GPS and sonar—to measure how sandy coastlines change over time. Sandy coastlines are a valuable resource that protect human-made structures from waves, serve as habitat for important species, and provide a variety of recreational opportunities.
Mapping the Seafloor
Sea Floor Mapping Group
California Seafloor Mapping Program
Coastal National Elevation Database (CoNED) Applications Project
Geologic Mapping of the Massachusetts Seafloor
Sediment Mobility Research
Cascadia Subduction Zone Marine Geohazards
Exploring the Unknown in the Deep North Atlantic Ocean
The seafloor has distinct features and characteristics that help us better understand Earth’s current and past conditions, potential resources, and natural hazards. However, less than 10% of the seafloor has been mapped globally. The USGS conducts high-resolution mapping to describe the physical features of the ocean floor, as well as the geologic layers and structure beneath it.
What's on the seafloor?
The ocean covers more than 70% of the Earth’ surface, yet only a small part of the seafloor has been mapped with enough detail to understand the basic structure, risks, and living and mineral resources that exist there. Characterizing the ocean floor expands our ability to better understand large scale Earth processes along with improved knowledge about the seafloor, deep sea minerals and associated ecosystems. Through this process we can build a more complete view of Earth history, begin to recognize changes, and provide predictions about how the seafloor, underwater environments, and marine geohazards may change in the future.


Sources/Usage: Public Domain. View Media Details
Technology and Innovation in Seafloor Mapping
Just like the Earth’s land surface, the seafloor contains significant geological and biological features. Geological features include mountains, canyons, plateaus, ledges, and submarine volcanoes, all of which have variable substrate that can range from rocky outcrops to extensive muddy plains, sand ripples, and giant sediment fans along with chemical seeps. Visit the Ocean 101 page to learn more. View a slideshow featuring thickets of coral reefs, sponges, mussels, and the many wondrous creatures that live and move among them.
The USGS designs mapping research programs to address a wide range of topics, and to expand our understanding of deep sea minerals, offshore energy, marine biological habitats, hazards, and more. The USGS uses acoustic techniques to collect detailed information about the seafloor, such as its shape, sediment composition and distribution, and underlying geologic structure and sediment type. Seafloor video, photographs, sediment cores, and other samples are also collected to validate the acoustics and provide a comprehensive foundation for studies of sediment and contaminant transport, landslide and tsunami hazards, gas hydrates, methane and carbon flux, benthic habitat quality, and sediment availability. Managers, policymakers, and other stakeholders use the map products derived from these studies to make informed decisions regarding the Nation’s safety and economic prosperity.


Sources/Usage: Public Domain. View Media Details
USGS Role in Seafloor Mapping
From habitats to hazards, here are some examples of USGS seafloor mapping efforts.
Media

As part of the National Strategy for Ocean Mapping, Exploration, and Characterization (NOMEC) initiative, USGS is helping to guide strategic planning, determining priority areas for ocean mapping and characterization, and collecting data and information to better understand the functions and ecological balance of deep-sea environments. The White House Ocean Science and Technology Subcommittee released the NOMEC Strategy in June 2020 to coordinate mapping, exploration, and characterization activities across federal agencies. Check out USGS mapping efforts along the Atlantic margin and Pacific margin.
Sources/Usage: Public Domain. View Media Details
Media

USGS maps the seafloor to identify and characterize habitats such as mesophotic coral ecosystems, deepwater coral ecosystems, deep-ocean environments, and more.
Sources/Usage: Public Domain. View Media Details
Media

USGS seafloor mapping efforts help identify potential hazards like subduction zones where earthquakes could occur and trigger tsunamis, and areas of resource interest such as mineral deposits and areas for offshore wind energy.
Sources/Usage: Public Domain. View Media Details
Mapping the Continental Shelf
The USGS maps continental shelf areas to understand coastal system evolution, from sediment transport to habitat use. Through marine geologic mapping and characterization of inner continental shelf areas, USGS science expands understanding of coastal vulnerability, sediment sources, transport pathways, habitat type and ecosystem characteristics. These activities advance the research and technology essential to coastal evolution and environmental change science while also supporting state and national partners in managing coastal and marine resources and related decisions.
Media

The Delmarva Peninsula is a 220-kilometer-long headland, spit, and barrier island complex that was significantly affected by Hurricane Sandy. To better constrain controls on coastal vulnerability and evolution, the region’s sediment sources, transport pathways and sediment sinks must be identified. This project defines the geologic framework of the Delmarva coastal system through geophysical mapping of the inner continental shelf. Learn more
Sources/Usage: Public Domain. View Media Details
Media

The U.S. Geological Survey, in cooperation with the Massachusetts Office of Coastal Zone Management (CZM) is conducting geologic mapping of the sea floor of the Massachusetts inner continental shelf to characterize the surface and shallow subsurface geologic framework within the Massachusetts coastal zone. The overall goal of this project is to determine the geologic framework of the sea floor within the Massachusetts coastal zone, using high-resolution geophysical techniques, sediment sampling, and sea floor photography. Learn more
Sources/Usage: Public Domain. View Media Details
Media

The California Seafloor Mapping Program (CSMP) is a cooperative program to create a comprehensive coastal and marine geologic and habitat base map series for all of California's State waters. The CSMP has collected bathymetry (underwater topography) and backscatter data (providing insight into the geologic makeup of the seafloor) that are being turned into habitat and geologic base maps for all of California's State Waters (mean high water line out to three nautical miles). Learn more
Sources/Usage: Public Domain. View Media Details
Mapping Beyond the Continental Shelf
Mapping of seafloor and geologic structure beyond the continental shelf is foundational to enhancing stewardship of natural resources, promoting economic prosperity, and strengthening the nation’s security.
Media

According to Article 76 of the Convention on the Law of the Sea, the United States may extend its offshore seafloor domain beyond 200 M when certain criteria are met. The U.S. has an inherent interest in knowing the full extent of its ECS so that it can better protect, manage, and/or use the resources contained therein. USGS is committed to maintaining and applying state-of-the art ocean technology to increase understanding of earth history, document potential marine hazards, and identify U.S. ocean resources. Learn more.
Sources/Usage: Public Domain. View Media Details
Media

USGS combines expertise in mapping from the continental land mass to deep offshore areas including the continental slope, rise and abyssal plain. These mapping products inform science related to natural hazards, resource management and legal authorities regarding international boundaries.
Sources/Usage: Public Domain. View Media Details
Science

Exploring Biodiversity of the Deep Hawaiian Pacific Ocean with Seafloor Mapping and eDNA Technologies
Working in partnership with BOEM and the NOAA Ocean Exploration Cooperative Institute, scientists from the USGS will embark on a 10-day voyage to the outer limits of the U.S. Pacific waters south of Hawai’i to conduct seafloor mapping and autonomous environmental DNA sampling in order to investigate and characterize the geology and biology of the Hawaiian abyssal plain.

Delineating the U.S. Extended Continental Shelf
The United States has an interest in knowing the full extent of its continental shelf beyond 200 nautical miles from shore (called the extended continental shelf, or ECS) so that it can better protect, manage and use the resources of the seabed and subsoil contained therein. The USGS contributes to the ECS effort through membership and leadership on the interagency U.S. ECS Task Force, a group...

USGS Law of the Sea
The USGS Law of the Sea project helps to determine the outer limits of the extended continental shelf (ECS) of the United States. The ECS is that portion of the continental shelf beyond 200 nautical miles. It is an important maritime zone that holds many resources and vital habitats for marine life. Its size may exceed one million square kilometers, encompassing areas in the Arctic, Atlantic...

SQUID-5 camera system
The SQUID-5 is a Structure-from-Motion Quantitative Underwater Imaging Device with 5 cameras.

Cascadia Subduction Zone Marine Geohazards
Societal Issue: Uncertainty related to rupture extent, slip distribution, and recurrence of past subduction megathrust earthquakes in the Pacific Northwest (northern CA, OR, WA, and southern BC) leads to ambiguity in earthquake and tsunami hazard assessments and hinders our ability to prepare for future events.
By
Natural Hazards Mission Area, Coastal and Marine Hazards and Resources Program, Pacific Coastal and Marine Science Center, Santa Cruz Core Scanning Laboratory, Santa Cruz Core Laboratories, Santa Cruz Core Splitting Laboratory, Deep Sea Exploration, Mapping and Characterization, Subduction Zone Science
Multimedia

Jet Ski Bathymetric Surveying
The USGS uses a variety of survey tools—including personal watercraft (jet skis) equipped with GPS and sonar—to measure how sandy coastlines change over time. Sandy coastlines are a valuable resource that protect human-made structures from waves, serve as habitat for important species, and provide a variety of recreational opportunities.

Coral reef in La Parguera, Lajas, Puerto Rico, View 1
Coral reef in La Parguera, Lajas, Puerto Rico, View 1Coral reef in La Parguera, Lajas Puerto Rico shows various types and conditions of corals, including sea fan corals (Gorgonia) in the center.
Coral reef in La Parguera, Lajas, Puerto Rico, View 1
Coral reef in La Parguera, Lajas, Puerto Rico, View 1Coral reef in La Parguera, Lajas Puerto Rico shows various types and conditions of corals, including sea fan corals (Gorgonia) in the center.

Coral reef in La Parguera, Lajas, Puerto Rico, View 2
Coral reef in La Parguera, Lajas, Puerto Rico, View 2Coral reef in La Parguera, Lajas Puerto Rico shows a sea fan coral (Gorgonia) in the center, surrounded other corals and fishes.
Coral reef in La Parguera, Lajas, Puerto Rico, View 2
Coral reef in La Parguera, Lajas, Puerto Rico, View 2Coral reef in La Parguera, Lajas Puerto Rico shows a sea fan coral (Gorgonia) in the center, surrounded other corals and fishes.

What is Bathymetry?
Bathymetry is the science of measuring the depth of water in ocean, river and lake environments. Learn how USGS measures bathymetry in this video by the St. Petersburg Coastal and Marine Science Center, originally created for the 2021 virtual St. Petersburg Science Festival.
Bathymetry is the science of measuring the depth of water in ocean, river and lake environments. Learn how USGS measures bathymetry in this video by the St. Petersburg Coastal and Marine Science Center, originally created for the 2021 virtual St. Petersburg Science Festival.

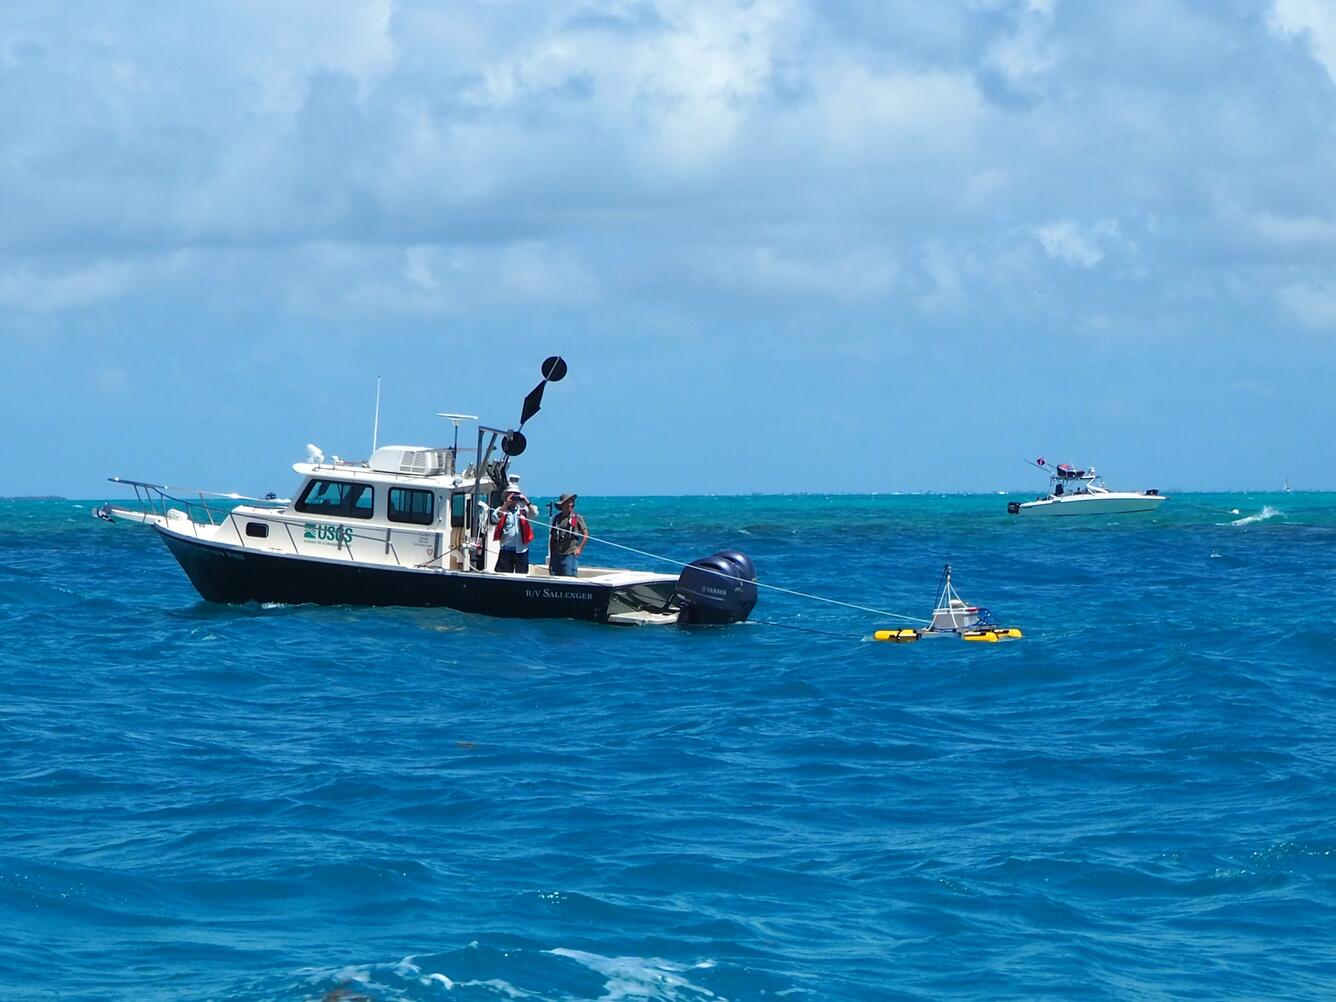
R/V Sallenger tows SQUID-5
The R/V Sallenger tows the SQUID-5 over Looe Key reef with a NOAA Sanctuary boat in the background patrolling the Looe Key area to warn recreational vessels of the ongoing research activity.
The R/V Sallenger tows the SQUID-5 over Looe Key reef with a NOAA Sanctuary boat in the background patrolling the Looe Key area to warn recreational vessels of the ongoing research activity.

ROV Deep Discoverer surveying boulder covered in bamboo coral
ROV Deep Discoverer surveying boulder covered in bamboo coralRemotely operated vehicle Deep Discoverer surveys a large boulder covered in bamboo corals during the 2021 North Atlantic Stepping Stones expedition. Bamboo corals were locally abundant on these large boulders and more spread out throughout different hard-bottom habitats.

NOAA-USGS Stepping Stones 2021 Expedition
Join USGS researchers Jason Chaytor and Kira Mizell as they virtually participate in a NOAA Ocean Exploration expedition to the depths of the North Atlantic.
Join USGS researchers Jason Chaytor and Kira Mizell as they virtually participate in a NOAA Ocean Exploration expedition to the depths of the North Atlantic.
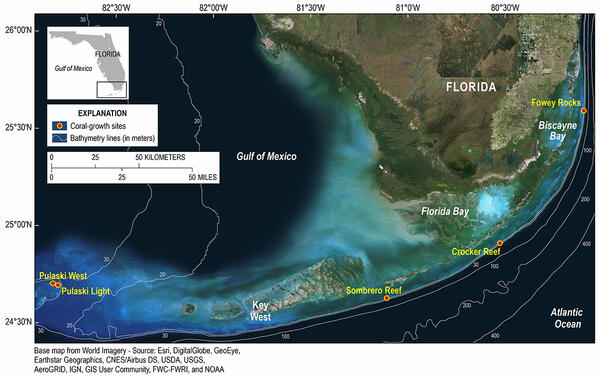
Map of coral calcification monitoring stations in Florida Keys
Map of coral calcification monitoring stations in Florida KeysThe USGS Coral Reef Ecosystems Studies project provides science that helps resource managers tasked with the stewardship of coral reef resources.
Map of coral calcification monitoring stations in Florida Keys
Map of coral calcification monitoring stations in Florida KeysThe USGS Coral Reef Ecosystems Studies project provides science that helps resource managers tasked with the stewardship of coral reef resources.
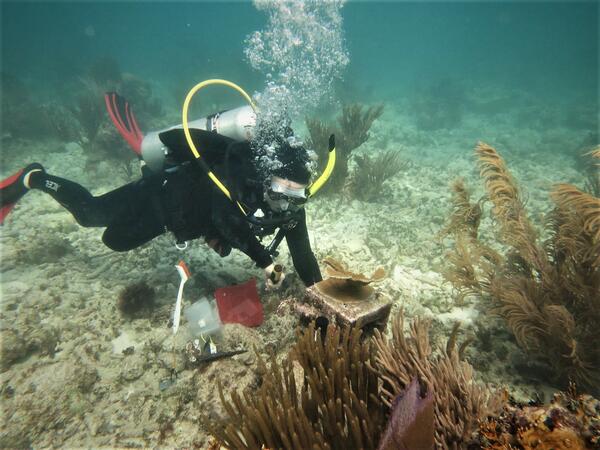
Diver visits experimental elkhorn coral in Dry Tortugas National Park
Diver visits experimental elkhorn coral in Dry Tortugas National ParkThe U.S. Geological Survey is conducting research to guide the restoration and recovery of the threatened elkhorn coral, Acropora palmata, in Dry Tortugas National Park and throughout the western Atlantic. In this photograph, research marine biologist Ilsa Kuffner is doing maintenance on a USGS “calcification station”.
Explore our science
Filter Total Items: 27

Geologic Mapping Offshore of Rhode Island
The U.S. Geological Survey (USGS), in cooperation with the National Oceanic and Atmospheric Administration (NOAA), is mapping sea-floor geology and sedimentary environments offshore of Rhode Island. This site provides links to bathymetric, sidescan-sonar, sediment, photographic, seismic-reflection, and interpretive datasets, all presented in Geographic Information System (GIS) formats and...

Geologic Evolution of Cat Island, Mississippi
The geologic evolution of Cat Island has been influenced by deltaic, lagoonal/estuarine, tidal, and oceanographic processes, resulting in a complex stratigraphic record.

Geologic and Morphologic Evolution of Coastal Margins
A combination of geophysics, sediment sampling, and chronology techniques are used to characterize the regional geomorphologic response of coastal systems to environmental changes.
Filter Total Items: 119

SeaBOSS operations in Massachusetts Bay, MA
SEABed Observation and Sampling System (SeaBOSS) operations were conducted near Stellwagen Bank offshore of Massachusetts in cooperation with the National Oceanic and Atmospheric Administration's Stellwagen Bank National Marine Sanctuary aboard the sanctuary's research vessel, the R/V Auk.
SEABed Observation and Sampling System (SeaBOSS) operations were conducted near Stellwagen Bank offshore of Massachusetts in cooperation with the National Oceanic and Atmospheric Administration's Stellwagen Bank National Marine Sanctuary aboard the sanctuary's research vessel, the R/V Auk.

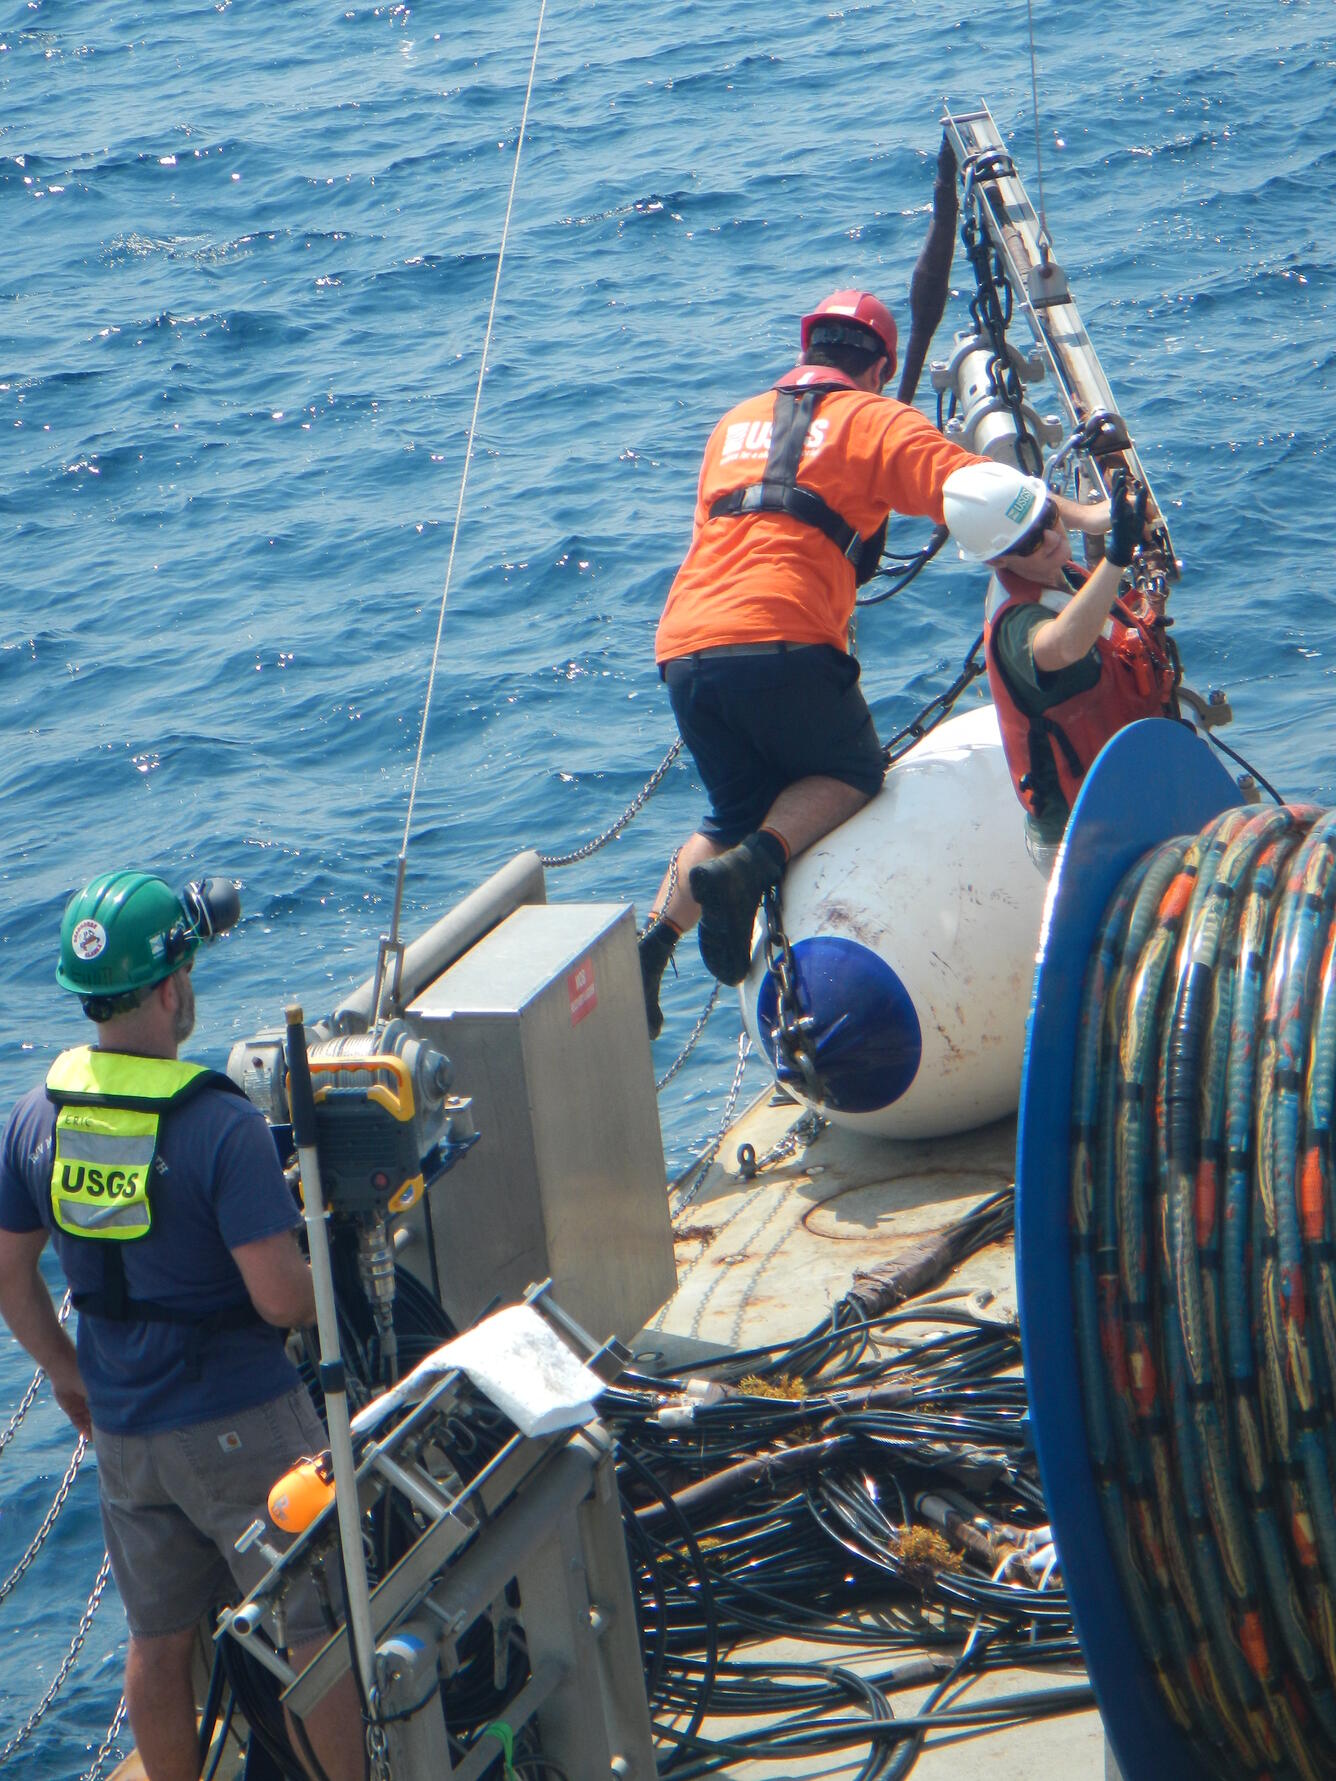
SEABoss Deployment on Stellwagen Bank
Page Valentine works with NOAA staff from the Stellwagen Bank National Marine Sanctuary to ready the SEABoss for deployment off the fantail of the NOAA R/V Auk.
Page Valentine works with NOAA staff from the Stellwagen Bank National Marine Sanctuary to ready the SEABoss for deployment off the fantail of the NOAA R/V Auk.

SeaBOSS on the fantail of the R/V Auk
Page Valentine and Dann Blackwood on the fantail of the NOAA R/V Auk. Dann is photographing a sediment sample collected on the seabed.
Page Valentine and Dann Blackwood on the fantail of the NOAA R/V Auk. Dann is photographing a sediment sample collected on the seabed.

SeaBOSS Deck Work Outtake
SeaBOSS operations were conducted north of Nantucket, MA as part of an agreement with the Massachusetts Office of Coastal Zone Management to map the geology of MA waters.
SeaBOSS operations were conducted north of Nantucket, MA as part of an agreement with the Massachusetts Office of Coastal Zone Management to map the geology of MA waters.

SeaBOSS off Nantucket, MA
SEABed Observation and Sampling System (SeaBOSS) operations were conducted north of Nantucket, MA as part of an agreement with Massachusetts Coastal Zone Management to map the geology of Massachusetts waters .
SEABed Observation and Sampling System (SeaBOSS) operations were conducted north of Nantucket, MA as part of an agreement with Massachusetts Coastal Zone Management to map the geology of Massachusetts waters .

Map of seabed geology and sun-illuminated topography, Stellwagen Bank
Map of seabed geology and sun-illuminated topography, Stellwagen BankMap of seabed geology and sun-illuminated topography, Stellwagen Bank Blue and purple = boulder ridges. Redlines = leading edges of sand sheets
Map of seabed geology and sun-illuminated topography, Stellwagen Bank
Map of seabed geology and sun-illuminated topography, Stellwagen BankMap of seabed geology and sun-illuminated topography, Stellwagen Bank Blue and purple = boulder ridges. Redlines = leading edges of sand sheets

Monterey Canyon and Vicinity
Map view. Colored shaded-relief bathymetry map of Monterey Canyon and Vicinity map area, generated from multibeam-echosounder and bathymetric-sidescan data. Colors show depth: reds and oranges indicate shallower areas; purples, deeper areas. Illumination azimuth is 300°, from 45° above horizon.
Map view. Colored shaded-relief bathymetry map of Monterey Canyon and Vicinity map area, generated from multibeam-echosounder and bathymetric-sidescan data. Colors show depth: reds and oranges indicate shallower areas; purples, deeper areas. Illumination azimuth is 300°, from 45° above horizon.

Schematic showing how sediment on the seafloor moves
Schematic showing how sediment on the seafloor movesSchematic showing how sediment on the seafloor moves in response to a force created by the combined action of tides, ocean waves, and wind-driven currents.
Schematic showing how sediment on the seafloor moves
Schematic showing how sediment on the seafloor movesSchematic showing how sediment on the seafloor moves in response to a force created by the combined action of tides, ocean waves, and wind-driven currents.

Seafloor mapping in southeastern Alaska
Mount Crillon in the backdrop during a multibeam bathymetry survey of the Queen Charlotte-Fairweather Fault, offshore southeastern Alaska.
Mount Crillon in the backdrop during a multibeam bathymetry survey of the Queen Charlotte-Fairweather Fault, offshore southeastern Alaska.

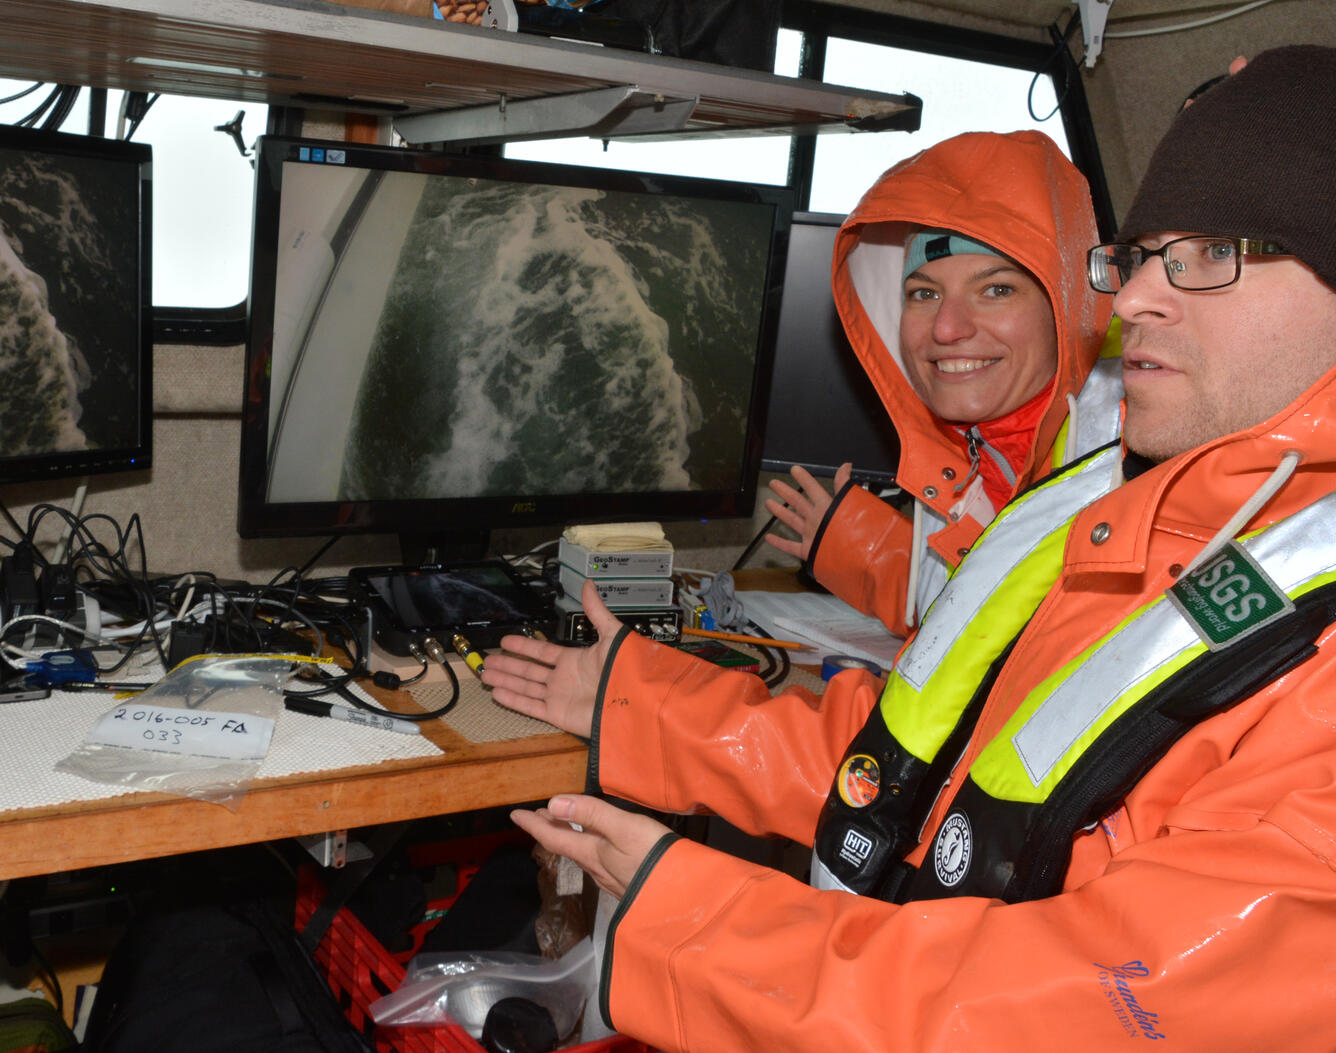
Wave breaking over Coral Reef
Underwater image of wave breaking over a coral reef.
Underwater image of wave breaking over a coral reef.

Potential Marine Benthic Habitats of Monterey Canyon and Vicinity
Potential Marine Benthic Habitats of Monterey Canyon and VicinityThe map on sheet 7 shows “potential” marine benthic habitats in the Monterey Canyon and Vicinity map area, representing a substrate type, geomorphology, seafloor process, or any other attribute that may provide a habitat for a specific species or assemblage of organisms.

Tripod with instruments on shallow seafloor
Tripod holding instruments and cameras used to measure and study aspects of sediment movement in and around the reef.
Tripod holding instruments and cameras used to measure and study aspects of sediment movement in and around the reef.
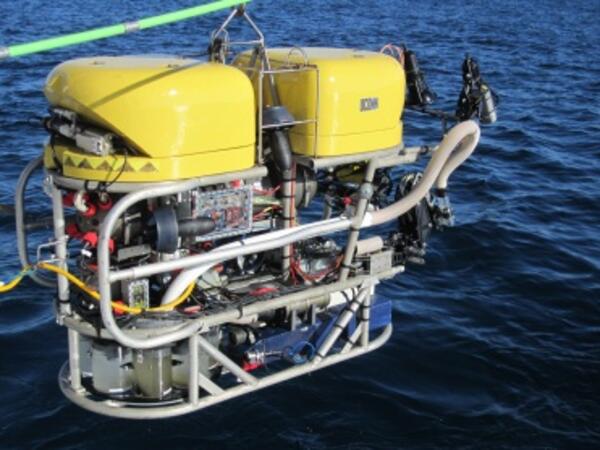
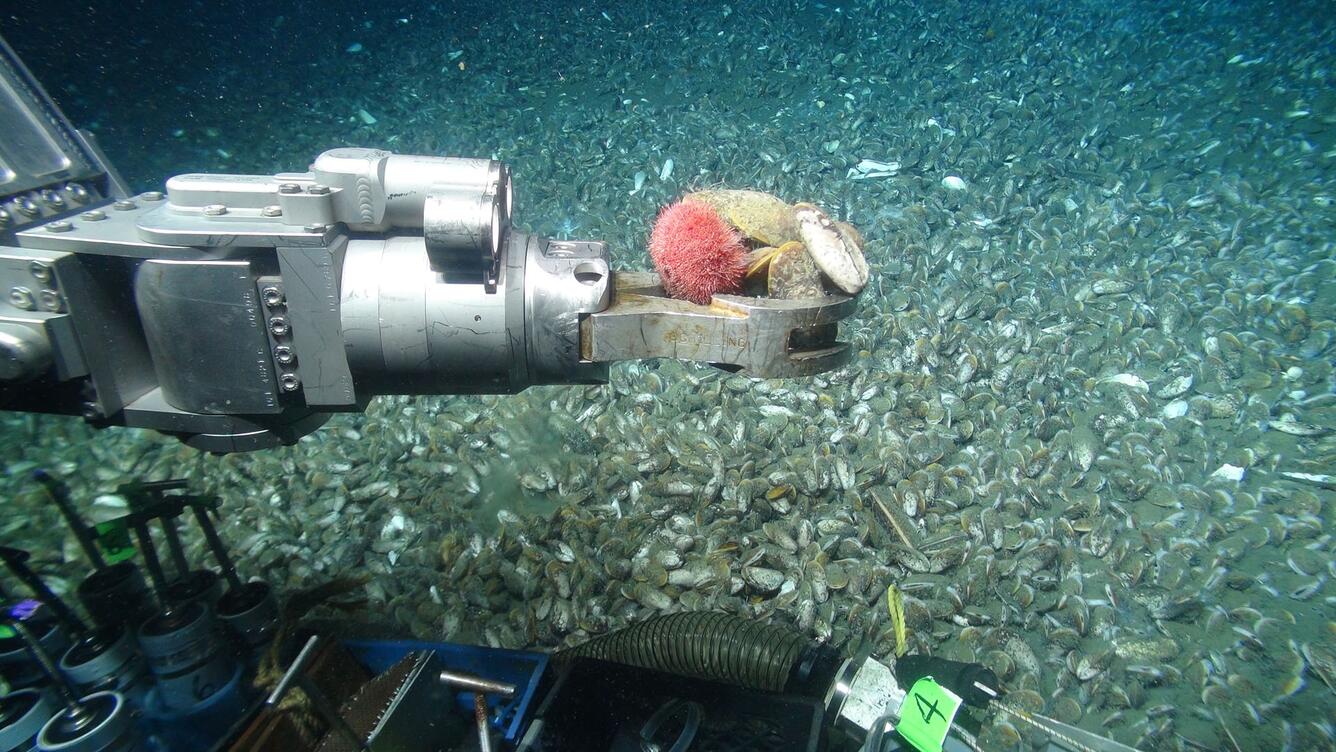
ROV/submersible used to sample the deep-sea canyon
ROV/submersible used to sample the deep-sea canyonROV/submersible used to sample the deep-sea canyon

Diverse deep sea coral species
Diverse deep sea coral species
Diverse deep sea coral species
Diverse deep sea coral species

Seafloor Character map of the Santa Cruz Region
“Seafloor Character” map of the Santa Cruz Region — This is a type of habitat map that classifies the seafloor based on surface hardness and roughness.
“Seafloor Character” map of the Santa Cruz Region — This is a type of habitat map that classifies the seafloor based on surface hardness and roughness.

Perspective view of the seafloor offshore Chenega village.
Perspective view of the seafloor offshore Chenega village.Perspective view of the seafloor offshore Chenega village. Light-blue patches in the intermediate basin outline sites of sediment loss between 1957 and 2014; the light-tan patch in the distal (lowermost) basin is a site of sediment deposition. Black arrows are interpreted sediment-flow pathways.

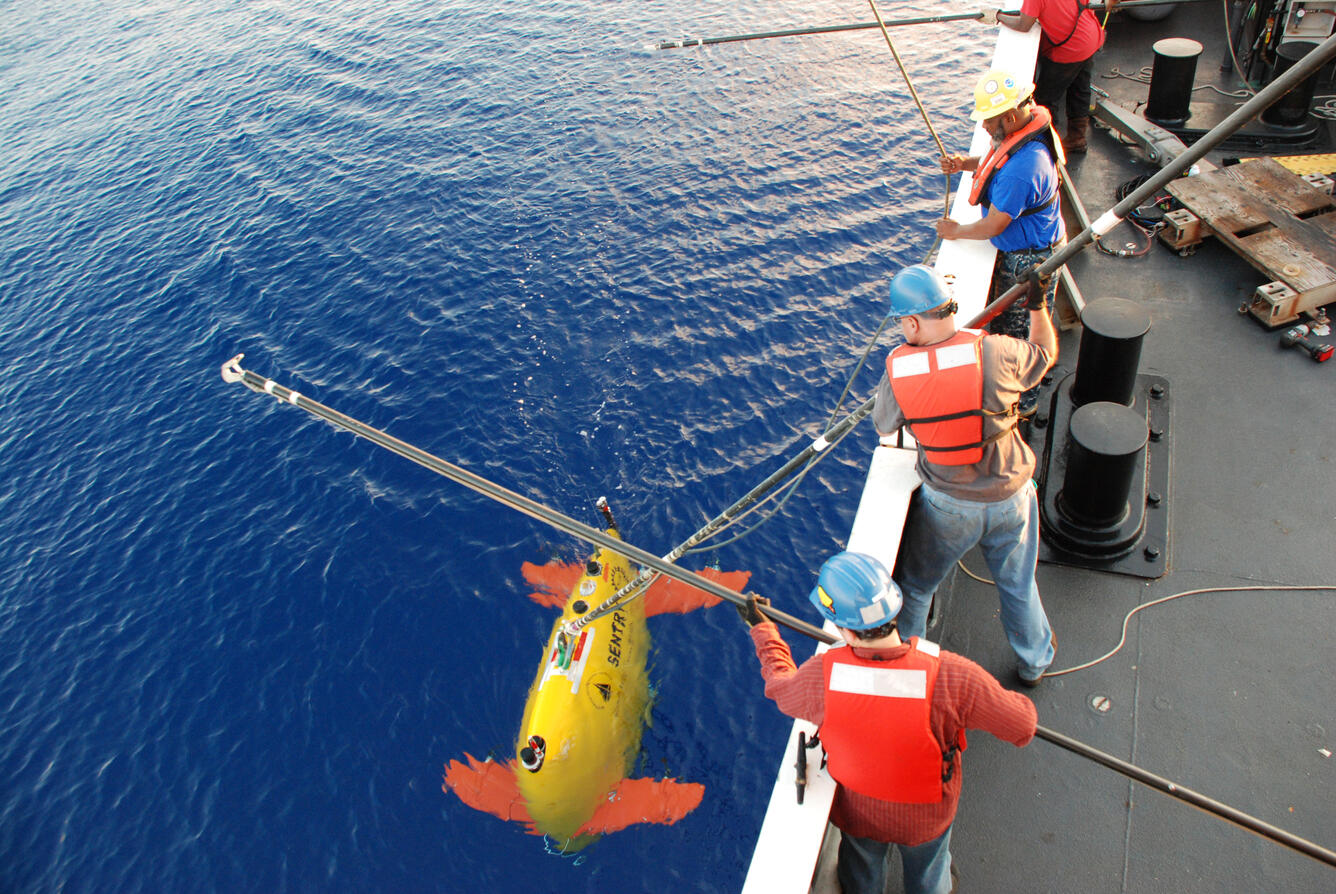
Remotely operated underwater vehicle
Remotely operated underwater vehicle

DISCOVRE Deep Sea Coral Gulf of Mexico

Coral coring in Dry Tortugas National Park
A diver uses an underwater drill to take a core sample from a massive brain coral (Diploria strigosa) in Dry Tortugas National Park.
A diver uses an underwater drill to take a core sample from a massive brain coral (Diploria strigosa) in Dry Tortugas National Park.
The seafloor has distinct features and characteristics that help us better understand Earth’s current and past conditions, potential resources, and natural hazards. However, less than 10% of the seafloor has been mapped globally. The USGS conducts high-resolution mapping to describe the physical features of the ocean floor, as well as the geologic layers and structure beneath it.
What's on the seafloor?
The ocean covers more than 70% of the Earth’ surface, yet only a small part of the seafloor has been mapped with enough detail to understand the basic structure, risks, and living and mineral resources that exist there. Characterizing the ocean floor expands our ability to better understand large scale Earth processes along with improved knowledge about the seafloor, deep sea minerals and associated ecosystems. Through this process we can build a more complete view of Earth history, begin to recognize changes, and provide predictions about how the seafloor, underwater environments, and marine geohazards may change in the future.
Sources/Usage: Public Domain. View Media Details
Technology and Innovation in Seafloor Mapping
Just like the Earth’s land surface, the seafloor contains significant geological and biological features. Geological features include mountains, canyons, plateaus, ledges, and submarine volcanoes, all of which have variable substrate that can range from rocky outcrops to extensive muddy plains, sand ripples, and giant sediment fans along with chemical seeps. Visit the Ocean 101 page to learn more. View a slideshow featuring thickets of coral reefs, sponges, mussels, and the many wondrous creatures that live and move among them.
The USGS designs mapping research programs to address a wide range of topics, and to expand our understanding of deep sea minerals, offshore energy, marine biological habitats, hazards, and more. The USGS uses acoustic techniques to collect detailed information about the seafloor, such as its shape, sediment composition and distribution, and underlying geologic structure and sediment type. Seafloor video, photographs, sediment cores, and other samples are also collected to validate the acoustics and provide a comprehensive foundation for studies of sediment and contaminant transport, landslide and tsunami hazards, gas hydrates, methane and carbon flux, benthic habitat quality, and sediment availability. Managers, policymakers, and other stakeholders use the map products derived from these studies to make informed decisions regarding the Nation’s safety and economic prosperity.
Sources/Usage: Public Domain. View Media Details
USGS Role in Seafloor Mapping
From habitats to hazards, here are some examples of USGS seafloor mapping efforts.
Media
As part of the National Strategy for Ocean Mapping, Exploration, and Characterization (NOMEC) initiative, USGS is helping to guide strategic planning, determining priority areas for ocean mapping and characterization, and collecting data and information to better understand the functions and ecological balance of deep-sea environments. The White House Ocean Science and Technology Subcommittee released the NOMEC Strategy in June 2020 to coordinate mapping, exploration, and characterization activities across federal agencies. Check out USGS mapping efforts along the Atlantic margin and Pacific margin.
Sources/Usage: Public Domain. View Media Details
Media
USGS maps the seafloor to identify and characterize habitats such as mesophotic coral ecosystems, deepwater coral ecosystems, deep-ocean environments, and more.
Sources/Usage: Public Domain. View Media Details
Media
USGS seafloor mapping efforts help identify potential hazards like subduction zones where earthquakes could occur and trigger tsunamis, and areas of resource interest such as mineral deposits and areas for offshore wind energy.
Sources/Usage: Public Domain. View Media Details
Mapping the Continental Shelf
The USGS maps continental shelf areas to understand coastal system evolution, from sediment transport to habitat use. Through marine geologic mapping and characterization of inner continental shelf areas, USGS science expands understanding of coastal vulnerability, sediment sources, transport pathways, habitat type and ecosystem characteristics. These activities advance the research and technology essential to coastal evolution and environmental change science while also supporting state and national partners in managing coastal and marine resources and related decisions.
Media
The Delmarva Peninsula is a 220-kilometer-long headland, spit, and barrier island complex that was significantly affected by Hurricane Sandy. To better constrain controls on coastal vulnerability and evolution, the region’s sediment sources, transport pathways and sediment sinks must be identified. This project defines the geologic framework of the Delmarva coastal system through geophysical mapping of the inner continental shelf. Learn more
Sources/Usage: Public Domain. View Media Details
Media
The U.S. Geological Survey, in cooperation with the Massachusetts Office of Coastal Zone Management (CZM) is conducting geologic mapping of the sea floor of the Massachusetts inner continental shelf to characterize the surface and shallow subsurface geologic framework within the Massachusetts coastal zone. The overall goal of this project is to determine the geologic framework of the sea floor within the Massachusetts coastal zone, using high-resolution geophysical techniques, sediment sampling, and sea floor photography. Learn more
Sources/Usage: Public Domain. View Media Details
Media
The California Seafloor Mapping Program (CSMP) is a cooperative program to create a comprehensive coastal and marine geologic and habitat base map series for all of California's State waters. The CSMP has collected bathymetry (underwater topography) and backscatter data (providing insight into the geologic makeup of the seafloor) that are being turned into habitat and geologic base maps for all of California's State Waters (mean high water line out to three nautical miles). Learn more
Sources/Usage: Public Domain. View Media Details
Mapping Beyond the Continental Shelf
Mapping of seafloor and geologic structure beyond the continental shelf is foundational to enhancing stewardship of natural resources, promoting economic prosperity, and strengthening the nation’s security.
Media
According to Article 76 of the Convention on the Law of the Sea, the United States may extend its offshore seafloor domain beyond 200 M when certain criteria are met. The U.S. has an inherent interest in knowing the full extent of its ECS so that it can better protect, manage, and/or use the resources contained therein. USGS is committed to maintaining and applying state-of-the art ocean technology to increase understanding of earth history, document potential marine hazards, and identify U.S. ocean resources. Learn more.
Sources/Usage: Public Domain. View Media Details
Media
USGS combines expertise in mapping from the continental land mass to deep offshore areas including the continental slope, rise and abyssal plain. These mapping products inform science related to natural hazards, resource management and legal authorities regarding international boundaries.
Sources/Usage: Public Domain. View Media Details
Science
Exploring Biodiversity of the Deep Hawaiian Pacific Ocean with Seafloor Mapping and eDNA Technologies
Working in partnership with BOEM and the NOAA Ocean Exploration Cooperative Institute, scientists from the USGS will embark on a 10-day voyage to the outer limits of the U.S. Pacific waters south of Hawai’i to conduct seafloor mapping and autonomous environmental DNA sampling in order to investigate and characterize the geology and biology of the Hawaiian abyssal plain.
Delineating the U.S. Extended Continental Shelf
The United States has an interest in knowing the full extent of its continental shelf beyond 200 nautical miles from shore (called the extended continental shelf, or ECS) so that it can better protect, manage and use the resources of the seabed and subsoil contained therein. The USGS contributes to the ECS effort through membership and leadership on the interagency U.S. ECS Task Force, a group...
USGS Law of the Sea
The USGS Law of the Sea project helps to determine the outer limits of the extended continental shelf (ECS) of the United States. The ECS is that portion of the continental shelf beyond 200 nautical miles. It is an important maritime zone that holds many resources and vital habitats for marine life. Its size may exceed one million square kilometers, encompassing areas in the Arctic, Atlantic...
SQUID-5 camera system
The SQUID-5 is a Structure-from-Motion Quantitative Underwater Imaging Device with 5 cameras.
Cascadia Subduction Zone Marine Geohazards
Societal Issue: Uncertainty related to rupture extent, slip distribution, and recurrence of past subduction megathrust earthquakes in the Pacific Northwest (northern CA, OR, WA, and southern BC) leads to ambiguity in earthquake and tsunami hazard assessments and hinders our ability to prepare for future events.
By
Natural Hazards Mission Area, Coastal and Marine Hazards and Resources Program, Pacific Coastal and Marine Science Center, Santa Cruz Core Scanning Laboratory, Santa Cruz Core Laboratories, Santa Cruz Core Splitting Laboratory, Deep Sea Exploration, Mapping and Characterization, Subduction Zone Science
Multimedia
Jet Ski Bathymetric Surveying
The USGS uses a variety of survey tools—including personal watercraft (jet skis) equipped with GPS and sonar—to measure how sandy coastlines change over time. Sandy coastlines are a valuable resource that protect human-made structures from waves, serve as habitat for important species, and provide a variety of recreational opportunities.
The USGS uses a variety of survey tools—including personal watercraft (jet skis) equipped with GPS and sonar—to measure how sandy coastlines change over time. Sandy coastlines are a valuable resource that protect human-made structures from waves, serve as habitat for important species, and provide a variety of recreational opportunities.
Coral reef in La Parguera, Lajas, Puerto Rico, View 1
Coral reef in La Parguera, Lajas, Puerto Rico, View 1Coral reef in La Parguera, Lajas Puerto Rico shows various types and conditions of corals, including sea fan corals (Gorgonia) in the center.
Coral reef in La Parguera, Lajas, Puerto Rico, View 1
Coral reef in La Parguera, Lajas, Puerto Rico, View 1Coral reef in La Parguera, Lajas Puerto Rico shows various types and conditions of corals, including sea fan corals (Gorgonia) in the center.
Coral reef in La Parguera, Lajas, Puerto Rico, View 2
Coral reef in La Parguera, Lajas, Puerto Rico, View 2Coral reef in La Parguera, Lajas Puerto Rico shows a sea fan coral (Gorgonia) in the center, surrounded other corals and fishes.
Coral reef in La Parguera, Lajas, Puerto Rico, View 2
Coral reef in La Parguera, Lajas, Puerto Rico, View 2Coral reef in La Parguera, Lajas Puerto Rico shows a sea fan coral (Gorgonia) in the center, surrounded other corals and fishes.
What is Bathymetry?
Bathymetry is the science of measuring the depth of water in ocean, river and lake environments. Learn how USGS measures bathymetry in this video by the St. Petersburg Coastal and Marine Science Center, originally created for the 2021 virtual St. Petersburg Science Festival.
Bathymetry is the science of measuring the depth of water in ocean, river and lake environments. Learn how USGS measures bathymetry in this video by the St. Petersburg Coastal and Marine Science Center, originally created for the 2021 virtual St. Petersburg Science Festival.
R/V Sallenger tows SQUID-5
The R/V Sallenger tows the SQUID-5 over Looe Key reef with a NOAA Sanctuary boat in the background patrolling the Looe Key area to warn recreational vessels of the ongoing research activity.
The R/V Sallenger tows the SQUID-5 over Looe Key reef with a NOAA Sanctuary boat in the background patrolling the Looe Key area to warn recreational vessels of the ongoing research activity.
ROV Deep Discoverer surveying boulder covered in bamboo coral
ROV Deep Discoverer surveying boulder covered in bamboo coralRemotely operated vehicle Deep Discoverer surveys a large boulder covered in bamboo corals during the 2021 North Atlantic Stepping Stones expedition. Bamboo corals were locally abundant on these large boulders and more spread out throughout different hard-bottom habitats.
NOAA-USGS Stepping Stones 2021 Expedition
Join USGS researchers Jason Chaytor and Kira Mizell as they virtually participate in a NOAA Ocean Exploration expedition to the depths of the North Atlantic.
Join USGS researchers Jason Chaytor and Kira Mizell as they virtually participate in a NOAA Ocean Exploration expedition to the depths of the North Atlantic.
Map of coral calcification monitoring stations in Florida Keys
Map of coral calcification monitoring stations in Florida KeysThe USGS Coral Reef Ecosystems Studies project provides science that helps resource managers tasked with the stewardship of coral reef resources.
Map of coral calcification monitoring stations in Florida Keys
Map of coral calcification monitoring stations in Florida KeysThe USGS Coral Reef Ecosystems Studies project provides science that helps resource managers tasked with the stewardship of coral reef resources.
Diver visits experimental elkhorn coral in Dry Tortugas National Park
Diver visits experimental elkhorn coral in Dry Tortugas National ParkThe U.S. Geological Survey is conducting research to guide the restoration and recovery of the threatened elkhorn coral, Acropora palmata, in Dry Tortugas National Park and throughout the western Atlantic. In this photograph, research marine biologist Ilsa Kuffner is doing maintenance on a USGS “calcification station”.
Explore our science
Filter Total Items: 27
Geologic Mapping Offshore of Rhode Island
The U.S. Geological Survey (USGS), in cooperation with the National Oceanic and Atmospheric Administration (NOAA), is mapping sea-floor geology and sedimentary environments offshore of Rhode Island. This site provides links to bathymetric, sidescan-sonar, sediment, photographic, seismic-reflection, and interpretive datasets, all presented in Geographic Information System (GIS) formats and...
Geologic Evolution of Cat Island, Mississippi
The geologic evolution of Cat Island has been influenced by deltaic, lagoonal/estuarine, tidal, and oceanographic processes, resulting in a complex stratigraphic record.
Geologic and Morphologic Evolution of Coastal Margins
A combination of geophysics, sediment sampling, and chronology techniques are used to characterize the regional geomorphologic response of coastal systems to environmental changes.
Filter Total Items: 119
SeaBOSS operations in Massachusetts Bay, MA
SEABed Observation and Sampling System (SeaBOSS) operations were conducted near Stellwagen Bank offshore of Massachusetts in cooperation with the National Oceanic and Atmospheric Administration's Stellwagen Bank National Marine Sanctuary aboard the sanctuary's research vessel, the R/V Auk.
SEABed Observation and Sampling System (SeaBOSS) operations were conducted near Stellwagen Bank offshore of Massachusetts in cooperation with the National Oceanic and Atmospheric Administration's Stellwagen Bank National Marine Sanctuary aboard the sanctuary's research vessel, the R/V Auk.
SEABoss Deployment on Stellwagen Bank
Page Valentine works with NOAA staff from the Stellwagen Bank National Marine Sanctuary to ready the SEABoss for deployment off the fantail of the NOAA R/V Auk.
Page Valentine works with NOAA staff from the Stellwagen Bank National Marine Sanctuary to ready the SEABoss for deployment off the fantail of the NOAA R/V Auk.
SeaBOSS on the fantail of the R/V Auk
Page Valentine and Dann Blackwood on the fantail of the NOAA R/V Auk. Dann is photographing a sediment sample collected on the seabed.
Page Valentine and Dann Blackwood on the fantail of the NOAA R/V Auk. Dann is photographing a sediment sample collected on the seabed.
SeaBOSS Deck Work Outtake
SeaBOSS operations were conducted north of Nantucket, MA as part of an agreement with the Massachusetts Office of Coastal Zone Management to map the geology of MA waters.
SeaBOSS operations were conducted north of Nantucket, MA as part of an agreement with the Massachusetts Office of Coastal Zone Management to map the geology of MA waters.
SeaBOSS off Nantucket, MA
SEABed Observation and Sampling System (SeaBOSS) operations were conducted north of Nantucket, MA as part of an agreement with Massachusetts Coastal Zone Management to map the geology of Massachusetts waters .
SEABed Observation and Sampling System (SeaBOSS) operations were conducted north of Nantucket, MA as part of an agreement with Massachusetts Coastal Zone Management to map the geology of Massachusetts waters .
Map of seabed geology and sun-illuminated topography, Stellwagen Bank
Map of seabed geology and sun-illuminated topography, Stellwagen BankMap of seabed geology and sun-illuminated topography, Stellwagen Bank Blue and purple = boulder ridges. Redlines = leading edges of sand sheets
Map of seabed geology and sun-illuminated topography, Stellwagen Bank
Map of seabed geology and sun-illuminated topography, Stellwagen BankMap of seabed geology and sun-illuminated topography, Stellwagen Bank Blue and purple = boulder ridges. Redlines = leading edges of sand sheets
Monterey Canyon and Vicinity
Map view. Colored shaded-relief bathymetry map of Monterey Canyon and Vicinity map area, generated from multibeam-echosounder and bathymetric-sidescan data. Colors show depth: reds and oranges indicate shallower areas; purples, deeper areas. Illumination azimuth is 300°, from 45° above horizon.
Map view. Colored shaded-relief bathymetry map of Monterey Canyon and Vicinity map area, generated from multibeam-echosounder and bathymetric-sidescan data. Colors show depth: reds and oranges indicate shallower areas; purples, deeper areas. Illumination azimuth is 300°, from 45° above horizon.
Schematic showing how sediment on the seafloor moves
Schematic showing how sediment on the seafloor movesSchematic showing how sediment on the seafloor moves in response to a force created by the combined action of tides, ocean waves, and wind-driven currents.
Schematic showing how sediment on the seafloor moves
Schematic showing how sediment on the seafloor movesSchematic showing how sediment on the seafloor moves in response to a force created by the combined action of tides, ocean waves, and wind-driven currents.
Seafloor mapping in southeastern Alaska
Mount Crillon in the backdrop during a multibeam bathymetry survey of the Queen Charlotte-Fairweather Fault, offshore southeastern Alaska.
Mount Crillon in the backdrop during a multibeam bathymetry survey of the Queen Charlotte-Fairweather Fault, offshore southeastern Alaska.
Wave breaking over Coral Reef
Underwater image of wave breaking over a coral reef.
Underwater image of wave breaking over a coral reef.
Potential Marine Benthic Habitats of Monterey Canyon and Vicinity
Potential Marine Benthic Habitats of Monterey Canyon and VicinityThe map on sheet 7 shows “potential” marine benthic habitats in the Monterey Canyon and Vicinity map area, representing a substrate type, geomorphology, seafloor process, or any other attribute that may provide a habitat for a specific species or assemblage of organisms.
Tripod with instruments on shallow seafloor
Tripod holding instruments and cameras used to measure and study aspects of sediment movement in and around the reef.
Tripod holding instruments and cameras used to measure and study aspects of sediment movement in and around the reef.
ROV/submersible used to sample the deep-sea canyon
ROV/submersible used to sample the deep-sea canyonROV/submersible used to sample the deep-sea canyon
Diverse deep sea coral species
Diverse deep sea coral species
Diverse deep sea coral species
Diverse deep sea coral species
Seafloor Character map of the Santa Cruz Region
“Seafloor Character” map of the Santa Cruz Region — This is a type of habitat map that classifies the seafloor based on surface hardness and roughness.
“Seafloor Character” map of the Santa Cruz Region — This is a type of habitat map that classifies the seafloor based on surface hardness and roughness.
Perspective view of the seafloor offshore Chenega village.
Perspective view of the seafloor offshore Chenega village.Perspective view of the seafloor offshore Chenega village. Light-blue patches in the intermediate basin outline sites of sediment loss between 1957 and 2014; the light-tan patch in the distal (lowermost) basin is a site of sediment deposition. Black arrows are interpreted sediment-flow pathways.
Remotely operated underwater vehicle
Remotely operated underwater vehicle
DISCOVRE Deep Sea Coral Gulf of Mexico
Coral coring in Dry Tortugas National Park
A diver uses an underwater drill to take a core sample from a massive brain coral (Diploria strigosa) in Dry Tortugas National Park.
A diver uses an underwater drill to take a core sample from a massive brain coral (Diploria strigosa) in Dry Tortugas National Park.