An official website of the United States government
Here's how you know
Official websites use .gov
A .gov website belongs to an official government organization in the United States.
Secure .gov websites use HTTPS
A lock () or https:// means you’ve safely connected to the .gov website. Share sensitive information only on official, secure websites.
Information on the flow of rivers and streams is a vital national asset that safeguards lives, protects property, and ensures adequate water supplies for the future. The USGS operates a network of more than 13,500 streamgages nationwide that provide streamflow information for a wide variety of uses including flood prediction, water management and allocation, engineering design, research, operation of locks and dams, and recreational safety and enjoyment.
USGS hydrographer Doug Ott inspects the gagehouse at USGS streamgage 13317000, Salmon River at White Bird, Idaho, May 10, 2013. The flow at the gage was approximately 40,000 cubic feet per second at the time of this photo. (Credit: Tim Merrick, USGS.)
The U.S. Geological Survey (USGS) established its first streamgage in 1889, on the Rio Grande River in New Mexico, to help determine if there was adequate water for irrigation, supporting development and western expansion. A streamgage is a hydrological monitoring location on a waterway. It contains equipment to measure and record water levels (gage height or stage). These data, often transmitted via satellite, are typically collected every 15 minutes and converted to streamflow (discharge) using a site-specific stage-discharge relationship developed from onsite water level and streamflow measurements made by USGS hydrographers. The USGS provides these data online through Water Data for the Nation.
Together, USGS streamgages constitute the National Streamgage Network. This network primarily consists of streamgages that provide continuous year-round streamflow data. However, several specialized gage types serve specific monitoring needs:
Stage-only gages record the water level (stage) of a stream, lake or reservoir. These lower-cost gages are used to monitor water-level trends, when streamflow information is not needed or not applicable.
Partial-record gages monitor specific flow conditions such as high flows, peak flows, and low flows. These include crest-stage gages, which record the maximum water level reached during a flood event and are used for flood-frequency analyses.
Seasonal streamgages operate only during specific times of the year, such as during irrigation season.
Rapid-deployment gages (RDGs) are temporary water level sensors installed on bridges or other structures above streams and rivers during emergencies when a streamgage does not exist or is damaged.
Supergages are a small subset of advanced streamgages that collect both streamflow and continuous water-quality data.
How Streamgages Monitor Streamflow
Measuring streamflow in rivers or streams is like taking the pulse of blood flow in a human body. It is important to measure streamflow so that scientists and water managers can make informed decisions about a river or stream’s health.
Streamgages do not measure streamflow directly. Monitoring streamflow involves several steps.
Stage Measurement:Streamflow monitoring begins by understanding the height – or stage – of the water in a stream.
Discharge Measurement: The volume of water passing a specific point in a given interval of time is called discharge. Discharge is calculated based on the stream stage, velocity, and the cross-sectional area of a particular part of a river.
Stage-Discharge Relationship: Each stream is different, therefore it’s essential to develop a stage-discharge relation for a site and apply the relation to the continuous stage record to compute streamflow
Stage Measurement
Stream stage can be measured using a variety of methods. These include the manual reading of staff gages, traditional float/stilling-well method and newer methods that use pressure transducers, bubbler systems or radar sensors.
Staff gages, which appear as measuring tapes permanently installed into rivers, provide visual measurements of stream stage that can be useful to make manual measurements by a hydrologic technician in the field. These are used during storms or to measure high water marks. They are also periodically referenced to visually verify the accuracy of the stage sensors that are published online.
A common approach to measuring stream stage is with a stilling well in the river bank or attached to a bridge pier. Water from the river enters and leaves the stilling well through underwater pipes allowing the water surface in the stilling well to be at the same elevation as the water surface in the river. The stage is then measured inside the stilling well using a float or a pressure, optic, or acoustic sensor. The measured stage value is stored in an electronic data recorder on a regular interval, usually every 15 minutes.
Diagram of a typical streamgage installation with equipment used to measure stream stage. (Credit: Althea Archer, USGS)
At some streamgage sites, a stilling well is not feasible or is not cost effective to install. As an alternative, stage can be determined by measuring the pressure required to maintain a small flow of gas through a tube and bubbled out at a fixed location under water in the stream (image to the right). The measured pressure is directly related to the height of water over the tube outlet in the stream. As the depth of water above the tube outlet increases, more pressure is required to push the gas bubbles through the tube.
Data collection and transmission follow a dynamic schedule.
Recording frequency - Stage is typically recorded every 15 minutes but can be as short as every 5 minutes during rapid rises caused by intense rainfall and runoff.
Data transmission - Data are transmitted by satellite to USGS servers every 1 to 4 hours. During periods of high water or emergency situations, transmission frequency increases to every 15 minutes to provide more timely information.
Stage measurements are precise, typically accurate to within ±0.01 foot or 0.2 percent of the effective stage.
Diagram of channel cross section with subsections. Subsection width is generally measured using a cable, steel tape, or similar piece of equipment. Subsection depth is measured using a wading rod, if conditions permit, or by suspending a sounding weight from a calibrated cable and reel system off a bridge, cableway, or boat or through a hole drilled in ice. (Credit: S.A. Olson and J.M. Norris, USGS)
Streamflow, or discharge, is the volume of water moving down a stream or river over a specific time and is commonly expressed in cubic feet per second (cfs) or gallons per day (gal/d). Because stream discharge cannot be measured directly, it must be computed from variables that can be measured directly, such as stream depth, stream width, and streamflow velocity. It is typically calculated by multiplying the cross-sectional area of water in a stream channel by the average velocity of the water in that cross section (see below). Although streamflow is computed from measurements of other variables, the terms “streamflow measurement” or “discharge measurement” are generally applied to the final result of the calculations.
Numerous types of equipment and methods are used by USGS personnel to make current-meter measurements because of the wide range of stream conditions throughout the United States. Two methods that are primarily used are:
Mechanical current-meter method - The stream channel cross section is divided into vertical subsections, and a current meter is used to estimate the velocity in each subsection. As water flows past the meter, a wheel of metal cups rotates. The speedof these rotations is electronically timed and translated into velocity for each section. Subsection velocities are multiplied by corresponding subsection areas and the values summed to compute total discharge for the cross section.
Acoustic Doppler Current Profiler (ADCP) method - ADCPs are modern hydroacoustic instruments that use sound pulses to measure velocity using the principles of the Doppler Effect. By measuring the frequency shift of sound reflecting off particles in the water, the ADCP creates a highly accurate, continuous profile of both water speed and direction across the entire channel.
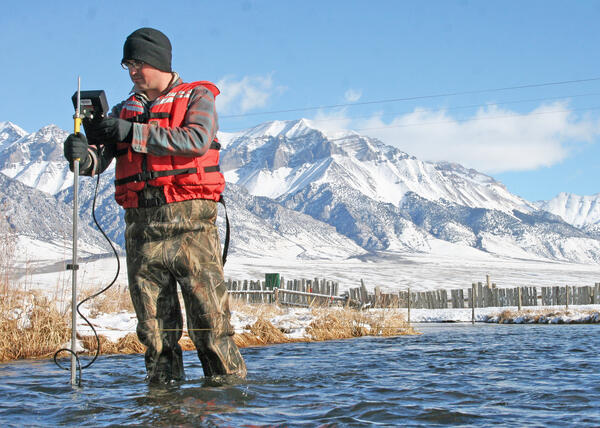
A hydrologic technician conducts a measurement in a stream using a mechanical current meter. An electronic signal is transmitted by the meter on each revolution allowing the revolutions to be counted and timed. Because the rate at which the cups revolve is directly related to the velocity of the water, the timed revolutions are used to determine the water velocity.
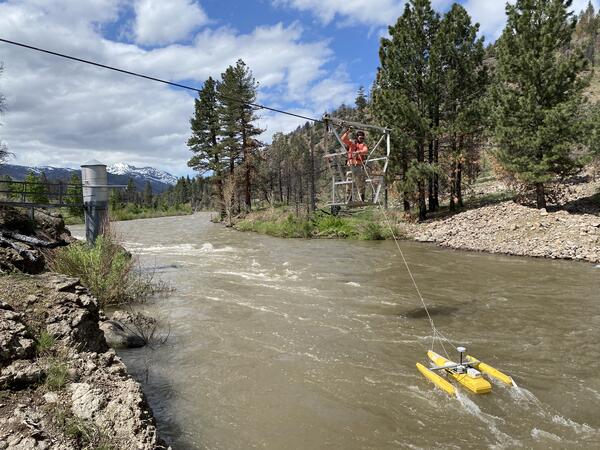
A USGS hydrographer makes an acoustic streamflow measurement from a cableway at streamgage 10308200 East Fork Carson River below Markleeville Creek, near Markleeville, CA. To make a discharge measurement, the ADCP is mounted onto a boat or into a small watercraft (diagram above) with its acoustic beams directed into the water from the water surface. The ADCP is then guided across the surface of the river to obtain measurements of velocity and depth across the channel. The river-bottom tracking capability of the ADCP acoustic beams or a Global Positioning System (GPS) is used to track the progress of the ADCP across the channel and provide channel-width measurements.
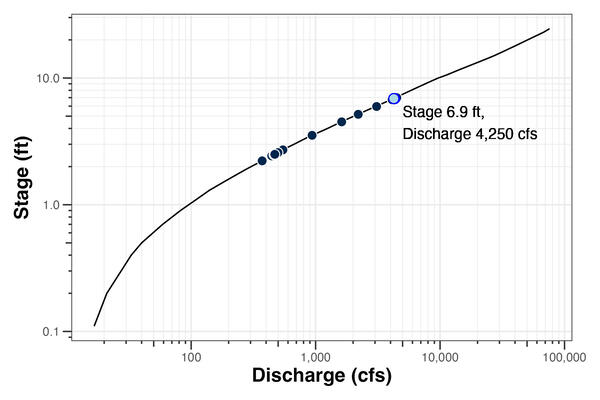
Example of a rating curve showing the relation between stage and discharge.
A stage-discharge rating curve depicts the relation between stream stage and stream discharge at a location along a stream, generally at a streamgage. Each point on a stage-discharge graph represents one discharge measurement. Because every stream has a unique channel shape, size, slope, and even channel roughness, every rating curve is site-specific.
Keeping rating curves accurate and up-to-date is important. Key aspects of maintaining rating curves include:
Data collection - Rating curves are developed from numerous discharge measurements collected over a period of time, and varying conditions, from droughts to floods.
Frequent updates - Changes in a stream channel can impact the rating curve. Changes in stream channels are often caused by erosion or deposition of streambed materials, seasonal vegetation growth, debris, or ice. New discharge measurements plotted on an existing stage-discharge relation graph would show this, and the rating could be adjusted to allow the correct discharge to be estimated for the measured stage. USGS hydrographers visit each gage about once every 6 weeks to make a discharge measurement and measure high flows when they happen to ensure the curve remains accurate.
Continuous monitoring - USGS computers are used to apply the stream-discharge rating curve for a given streamgage to its continuous stage data to estimate discharge for the site.
For complex environments, like tidal rivers or flat areas where stage doesn't reliably predict flow, modern instrumentation has made it possible to continuously monitor discharge in these streams using the index velocity method. A hydroacoustic or ultrasonic velocity meter, installed in a river, monitors water speed continuously. These data are paired with cross-sectional area to calculate discharge even when traditional rating curves fail.
From the Stream to Your Screen - Streamflow Data on the Internet
Diagram of how streamgage data is transferred to the internet. (Credit: Althea Archer, USGS)
Over 135 years of high-quality water data for more than one million monitoring locations are accessible from Water Data for the Nation. Data users include emergency responders, water managers, environmental and transportation agencies, universities, utilities, recreational enthusiasts, and consulting firms. Key applications of USGS water data include:
Public safety - ensuring streams are safe for recreational activities and managing drinking water facilities
Hazard mitigation - planning, forecasting, and warning about floods and droughts
Environmental protection - monitoring aquatic habitats, assessing water quality, and regulating pollutants
Infrastructure and utilities - designing reservoirs, roads, bridges, and managing waterways for power production and navigation
Resource management - managing water rights and transboundary issues, and tracking impacts to streamflow from changing land and water uses
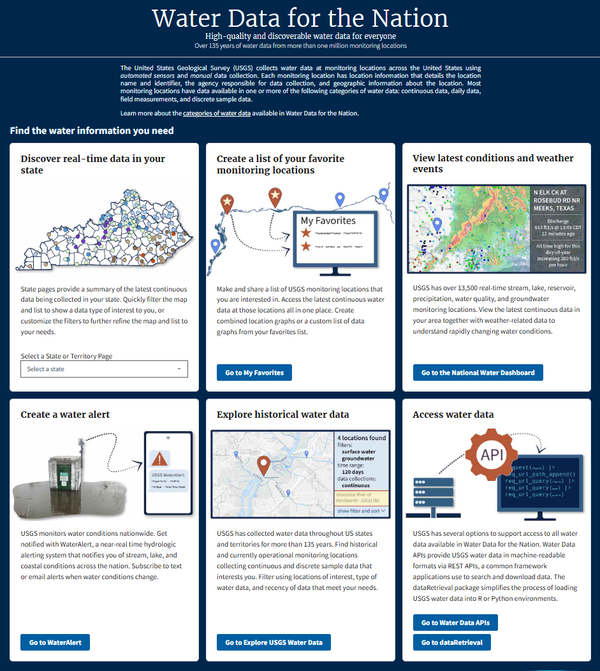
Screenshot of the Water Data for the Nation (WDFN) homepage. WDFN is the home for USGS's modernization of public delivery of water data. USGS water data can be accessed in many ways: Monitoring Location Pages provide a source of centralized water data, including graphs, stats, and tables of observed water real-time and historical data; interactive maps display real-time conditions and allow exploration; email and text alerts of real-time water conditions, Application Programming Interfaces (APIs); and software packages allow programmatic access.
Screenshot of the new Water Data for the Nation hydrograph for continuous monitoring locations.
How are new gage sites established?
The USGS can install a streamgage almost anywhere, but in most cases, we do not choose when and where to do that. We typically install and operate streamgages where other entities ask and reimburse us to do so.
USGS selects a suitable site along a river or stream and constructs a gage house to hold equipment that measures and records the height of the water surface (gage height or stage). The gage house also can hold equipment that measures water-quality parameters, such as temperature, pH, dissolved oxygen, and dissolved chemicals, and weather conditions, such as air temperature, precipitation, and wind speed.
If there is need for a streamgage in your area, reach out to a local government agency and ask them to contact the USGS about entering into an agreement to install and operate a new gage.
Below is other information associated with USGS streamgaging activities.
As of October 2024, the USGS Groundwater and Streamflow Information Program supports the collection and (or) delivery of both streamflow and water-level information at 8,705 sites and water-level information alone at 3,460 additional sites. The data are served online—most in near real-time—to meet many diverse needs including the protection of life, property, the environment, and our economy.
As of October 2024, the USGS Groundwater and Streamflow Information Program supports the collection and (or) delivery of both streamflow and water-level information at 8,705 sites and water-level information alone at 3,460 additional sites. The data are served online—most in near real-time—to meet many diverse needs including the protection of life, property, the environment, and our economy.
Federal Priority Streamgages (FPS) are automated stations that monitor water conditions in streams and rivers throughout the country. Originally established in 1999, these are important for meeting specific long-term needs of the Nation. The FPS Network was recently re-prioritized which resulted in size of the network increasing to nearly 12,400 locations.
Federal Priority Streamgages (FPS) are automated stations that monitor water conditions in streams and rivers throughout the country. Originally established in 1999, these are important for meeting specific long-term needs of the Nation. The FPS Network was recently re-prioritized which resulted in size of the network increasing to nearly 12,400 locations.
To manage our water resources effectively, we need to understand how much water is available and its usefulness. The USGS monitors the nation’s water resources through various national observing networks that use a range of technologies and methods to assess real-time water conditions and predict future changes in water availability for human and ecological uses.
To manage our water resources effectively, we need to understand how much water is available and its usefulness. The USGS monitors the nation’s water resources through various national observing networks that use a range of technologies and methods to assess real-time water conditions and predict future changes in water availability for human and ecological uses.
Rapid Deployment Gages (RDGs) are fully-functional streamgages designed to be deployed quickly and temporarily to measure and transmit stream stage data in emergency situations.
Rapid Deployment Gages (RDGs) are fully-functional streamgages designed to be deployed quickly and temporarily to measure and transmit stream stage data in emergency situations.
During large coastal storms, the storm surge and waves are the main cause of destruction and landscape change, transporting saline water, sediment, and debris inland. The USGS, in collaboration with stakeholders, has constructed a national Surge, Wave, and Tide Hydrodynamics (SWaTH) Network for the Atlantic, Eastern Pacific, and Central Pacific. SWaTH monitors and documents the height, extent, and...
Surge, Wave, and Tide Hydrodynamics (SWaTH) Network
During large coastal storms, the storm surge and waves are the main cause of destruction and landscape change, transporting saline water, sediment, and debris inland. The USGS, in collaboration with stakeholders, has constructed a national Surge, Wave, and Tide Hydrodynamics (SWaTH) Network for the Atlantic, Eastern Pacific, and Central Pacific. SWaTH monitors and documents the height, extent, and...
The USGS collects water data daily across the U.S. using sensors that automatically sample the data at set intervals. We have over 11,000 of these devices, known as gages, in our nationwide network.
The data from these gages are used in decision-making at all levels, from recreationists to congresspersons.
Whether you drink water from your tap, use electricity or canoe down your local river, chances are you benefit from USGS streamgage information. So what is a streamgage and what does it do for you? This CoreCast episode gives you the inside scoop on your silent superhero.
Whether you drink water from your tap, use electricity or canoe down your local river, chances are you benefit from USGS streamgage information. So what is a streamgage and what does it do for you? This CoreCast episode gives you the inside scoop on your silent superhero.
Information on the flow of rivers and streams is a vital national asset that safeguards lives, protects property, and ensures adequate water supplies for the future. The U.S. Geological Survey (USGS) operates a network of more than 9,000 streamgages nationwide with more than 500 in Texas.
The U.S. Geological Survey (USGS) operated 12,165 continuous surface-water monitoring locations (streamgages) across the United States in 2024. The streamgages provide information on river height and streamflow, typically at 15-minute intervals. This information is then made available to everyone, most of it delivered nearly in realtime on the USGS National Water Dashboard.
The U.S. Geological Survey (USGS) operated 11,850 continuous surface-water monitoring locations (streamgages) across the United States in 2023. The streamgages provide information on river height and streamflow, typically at 15-minute intervals. This information is then made available to everyone, most of it delivered nearly in realtime on the USGS National Water Dashboard.
The Federal Priority Streamgage (FPS) network of the U.S. Geological Survey (USGS), created in 1999 as the National Streamflow Information Program, receives Congressional appropriations to support the operation of a federally-funded “backbone” network of streamflow gages across the United States that are designated to meet the “Federal needs” or priorities of the country. Anticipating...
Authors
Jonathan J.A. Dillow, Brian E. McCallum, Cory E. Angeroth
In the late 1800s, John Wesley Powell, second Director of the U.S. Geological Survey (USGS), proposed gaging the flow of rivers and streams in the Western United States to evaluate the potential for irrigation. Around the same time, several cities in the Eastern United States established primitive streamgages to help design water-supply systems. Streamgaging technology has greatly...
Authors
Sandra M. Eberts, Michael D. Woodside, Mark N. Landers, Chad R. Wagner
Application of the index velocity method for computing continuous records of discharge has become increasingly common, especially since the introduction of low-cost acoustic Doppler velocity meters (ADVMs) in 1997. Presently (2011), the index velocity method is being used to compute discharge records for approximately 470 gaging stations operated and maintained by the U.S. Geological...
The techniques used in making discharge measurements at gaging stations are described in this report. Most of the report deals with the current-meter method of measuring discharge, because this is the principal method used in gaging streams. The use of portable weirs and flumes, floats, and volumetric tanks in measuring discharge are briefly described.
Continuous measurements of stream stage are used in determining records of stream discharge. In addition a record of stream stage is useful in itself, as in designing structures affected by stream elevation or in planning the use of flood plains. This report describes instruments and structures commonly used in obtaining a record of stream stage.
The National Water Dashboard (NWD) is a mobile, interactive tool that provides real-time information on water levels, weather, and flood forecasts - all in one place on a computer, smartphone, or other mobile device. The NWD presents real-time stream, lake and reservoir, precipitation, and groundwater data from more than 13,500 USGS observation stations across the country.
This site is the home for modernized access to USGS water data in machine-readable formats via REST APIs, a common type of web service programs use to search and download data. These services provide USGS water data, ranging from continuous measurements of streamflow to information about individual USGS sites and more.
Water information is fundamental to national and local economic well-being, protection of life and property, and effective management of the Nation’s water resources. The Water Data Blog posts highlight water data developments, data, and applications.
The U.S. Geological Survey WaterAlert service provides notifications to your email or phone for changes in water conditions based on thresholds you choose.
This mapper identifies USGS Federal Priority Streamgages (FPS). FPS are monitoring stations that track the amount of water in streams and rivers across the Nation to meet long-term federal information needs. They are strategically positioned to serve as a backbone for the larger National Streamflow Network that is operated in cooperation with over 1,200 federal, state, tribal, and local agencies.
The USGS has been measuring streamflow since 1889. Explore how USGS streamgages have been supporting our Nation's changing water-resource needs and priorities for 130 years in an interactive data visualization story.
This mapper identifies USGS streamgages that are in danger of being discontinued or converted to a reduced level of service due to lack of funding, gages that already have been discontinued, and gages that have been ‘rescued’ by a new funding source.
Information on the flow of rivers is a vital national asset that safeguards lives, protects property, and ensures adequate water supplies for the future. The USGS is the federal agency responsible for operating a network of about 7,000 streamgages nationwide. Data from this network are used by water managers, emergency responders, utilities, environmental agencies, universities, consulting firms...
Information on the flow of rivers is a vital national asset that safeguards lives, protects property, and ensures adequate water supplies for the future. The USGS is the federal agency responsible for operating a network of about 7,000 streamgages nationwide. Data from this network are used by water managers, emergency responders, utilities, environmental agencies, universities, consulting firms...
Streams are like living things and are constantly changing. Sometimes streams erode, becoming deeper, while other times streams deposit sediment, becoming shallower. To understand how those changes can affect streamflow, we need to measure from a reference point that does not change over time, which is why gage datums are chosen to be below the base of a streambed. This means that the gage datum...
Why doesn’t USGS measure gage height from the bottom of the stream?
Streams are like living things and are constantly changing. Sometimes streams erode, becoming deeper, while other times streams deposit sediment, becoming shallower. To understand how those changes can affect streamflow, we need to measure from a reference point that does not change over time, which is why gage datums are chosen to be below the base of a streambed. This means that the gage datum...
The USGS can install a streamgage almost anywhere, but in most cases we do not choose when and where to do that. We typically install and operate streamgages where other entities ask and reimburse us to do so. We operate streamgages for entities such as cities, towns, counties, state agencies, and other federal agencies to assist with their missions and to provide data for general public use...
The USGS can install a streamgage almost anywhere, but in most cases we do not choose when and where to do that. We typically install and operate streamgages where other entities ask and reimburse us to do so. We operate streamgages for entities such as cities, towns, counties, state agencies, and other federal agencies to assist with their missions and to provide data for general public use...
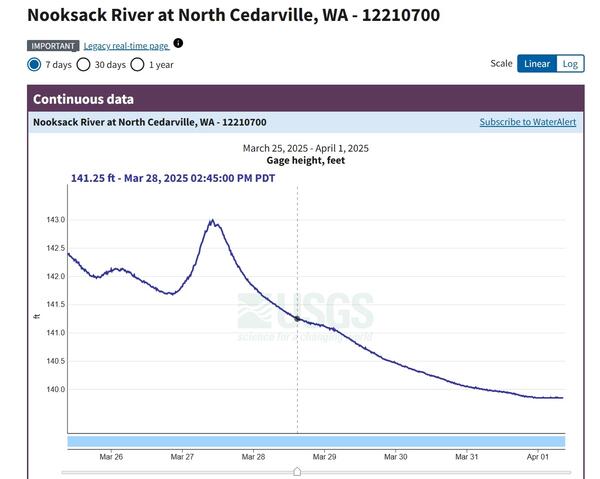
There can be occasional equipment or database problems where erroneous data are reported for short periods of time until corrections can be made. This is why it is important to look at a record of streamflow (like the 7-day hydrograph plots) rather than a single point in time. However, most of the time the USGS has a high level of confidence in its real-time stage data. During low streamflow...
Sometimes the USGS real-time stage data seems too high (or too low). Are the USGS data inaccurate?
There can be occasional equipment or database problems where erroneous data are reported for short periods of time until corrections can be made. This is why it is important to look at a record of streamflow (like the 7-day hydrograph plots) rather than a single point in time. However, most of the time the USGS has a high level of confidence in its real-time stage data. During low streamflow...
Stream stage (aka gage height) is an important concept when analyzing how much water is moving in a stream at any given moment. "Stage" is the water level above some arbitrary point in the river and is commonly measured in feet. For example, on a normal day when no rain has fallen for a while, a river might have a stage of 2 feet. If a big storm hits, the river stage could rise to 15 or 20 feet...
Stream stage (aka gage height) is an important concept when analyzing how much water is moving in a stream at any given moment. "Stage" is the water level above some arbitrary point in the river and is commonly measured in feet. For example, on a normal day when no rain has fallen for a while, a river might have a stage of 2 feet. If a big storm hits, the river stage could rise to 15 or 20 feet...
Not directly. You cannot say that because a stream rises (doubles) from a 10-foot stage to a 20-foot stage that the amount of flowing water also doubles. Think of a cereal bowl with a rounded bottom. Pour one inch of milk in it. It doesn't take much milk to make it up to the one inch level because the bowl is at its narrowest near the bottom. Now, pour in milk until it is two inches deep -- it...
Does "stage" tell you how much water is flowing in a stream?
Not directly. You cannot say that because a stream rises (doubles) from a 10-foot stage to a 20-foot stage that the amount of flowing water also doubles. Think of a cereal bowl with a rounded bottom. Pour one inch of milk in it. It doesn't take much milk to make it up to the one inch level because the bowl is at its narrowest near the bottom. Now, pour in milk until it is two inches deep -- it...
USGS real-time streamflow data are typically recorded at 15-minute intervals, stored onsite, and then transmitted to USGS offices once every hour, depending on the data relay technique used. Recording and transmission times might be more frequent during critical events (floods, for example). Data from current sites are relayed to USGS offices via satellite, telephone, and/or radio telemetry and...
USGS real-time streamflow data are typically recorded at 15-minute intervals, stored onsite, and then transmitted to USGS offices once every hour, depending on the data relay technique used. Recording and transmission times might be more frequent during critical events (floods, for example). Data from current sites are relayed to USGS offices via satellite, telephone, and/or radio telemetry and...
The USGS usually corrects any equipment or station problems at our streamgages within a few days of their occurrence. Occasionally, replacement parts or equipment might not be readily available, or a station might be inaccessible due to weather conditions. Most USGS streamgaging stations are operated in cooperation with other agencies. At some stations, the stage transmitting equipment is owned...
Why do some real-time streamgaging stations stop transmitting data for extended periods of time?
The USGS usually corrects any equipment or station problems at our streamgages within a few days of their occurrence. Occasionally, replacement parts or equipment might not be readily available, or a station might be inaccessible due to weather conditions. Most USGS streamgaging stations are operated in cooperation with other agencies. At some stations, the stage transmitting equipment is owned...
In order to convert gage height (or "stage", usually expressed as feet) into streamflow (or "discharge", usually expressed as cubic feet per second), USGS hydrographers must establish a relationship between them. This stage-discharge relationship is called a rating curve. It’s developed by making frequent manual discrete discharge measurements at stream gaging stations. The rating curve depends on...
How is a rating curve used to convert gage height into streamflow?
In order to convert gage height (or "stage", usually expressed as feet) into streamflow (or "discharge", usually expressed as cubic feet per second), USGS hydrographers must establish a relationship between them. This stage-discharge relationship is called a rating curve. It’s developed by making frequent manual discrete discharge measurements at stream gaging stations. The rating curve depends on...
Water Data for the Nation (WDFN) is the home for USGS streamflow, groundwater, and water quality data. Through WDFN you can find different tools to look at historic and real-time streamflow data, find sites of interest, and access using USGS water data application programming interfaces (APIs). State pages (e.g., California) allow you to discover real-time data in your state, or you can create a...
Where can I get real-time and historical streamflow information?
Water Data for the Nation (WDFN) is the home for USGS streamflow, groundwater, and water quality data. Through WDFN you can find different tools to look at historic and real-time streamflow data, find sites of interest, and access using USGS water data application programming interfaces (APIs). State pages (e.g., California) allow you to discover real-time data in your state, or you can create a...
Information on the flow of rivers and streams is a vital national asset that safeguards lives, protects property, and ensures adequate water supplies for the future. The USGS operates a network of more than 13,500 streamgages nationwide that provide streamflow information for a wide variety of uses including flood prediction, water management and allocation, engineering design, research, operation of locks and dams, and recreational safety and enjoyment.
USGS hydrographer Doug Ott inspects the gagehouse at USGS streamgage 13317000, Salmon River at White Bird, Idaho, May 10, 2013. The flow at the gage was approximately 40,000 cubic feet per second at the time of this photo. (Credit: Tim Merrick, USGS.)
The U.S. Geological Survey (USGS) established its first streamgage in 1889, on the Rio Grande River in New Mexico, to help determine if there was adequate water for irrigation, supporting development and western expansion. A streamgage is a hydrological monitoring location on a waterway. It contains equipment to measure and record water levels (gage height or stage). These data, often transmitted via satellite, are typically collected every 15 minutes and converted to streamflow (discharge) using a site-specific stage-discharge relationship developed from onsite water level and streamflow measurements made by USGS hydrographers. The USGS provides these data online through Water Data for the Nation.
Together, USGS streamgages constitute the National Streamgage Network. This network primarily consists of streamgages that provide continuous year-round streamflow data. However, several specialized gage types serve specific monitoring needs:
Stage-only gages record the water level (stage) of a stream, lake or reservoir. These lower-cost gages are used to monitor water-level trends, when streamflow information is not needed or not applicable.
Partial-record gages monitor specific flow conditions such as high flows, peak flows, and low flows. These include crest-stage gages, which record the maximum water level reached during a flood event and are used for flood-frequency analyses.
Seasonal streamgages operate only during specific times of the year, such as during irrigation season.
Rapid-deployment gages (RDGs) are temporary water level sensors installed on bridges or other structures above streams and rivers during emergencies when a streamgage does not exist or is damaged.
Supergages are a small subset of advanced streamgages that collect both streamflow and continuous water-quality data.
How Streamgages Monitor Streamflow
Measuring streamflow in rivers or streams is like taking the pulse of blood flow in a human body. It is important to measure streamflow so that scientists and water managers can make informed decisions about a river or stream’s health.
Streamgages do not measure streamflow directly. Monitoring streamflow involves several steps.
Stage Measurement:Streamflow monitoring begins by understanding the height – or stage – of the water in a stream.
Discharge Measurement: The volume of water passing a specific point in a given interval of time is called discharge. Discharge is calculated based on the stream stage, velocity, and the cross-sectional area of a particular part of a river.
Stage-Discharge Relationship: Each stream is different, therefore it’s essential to develop a stage-discharge relation for a site and apply the relation to the continuous stage record to compute streamflow
Stage Measurement
Stream stage can be measured using a variety of methods. These include the manual reading of staff gages, traditional float/stilling-well method and newer methods that use pressure transducers, bubbler systems or radar sensors.
Staff gages, which appear as measuring tapes permanently installed into rivers, provide visual measurements of stream stage that can be useful to make manual measurements by a hydrologic technician in the field. These are used during storms or to measure high water marks. They are also periodically referenced to visually verify the accuracy of the stage sensors that are published online.
A common approach to measuring stream stage is with a stilling well in the river bank or attached to a bridge pier. Water from the river enters and leaves the stilling well through underwater pipes allowing the water surface in the stilling well to be at the same elevation as the water surface in the river. The stage is then measured inside the stilling well using a float or a pressure, optic, or acoustic sensor. The measured stage value is stored in an electronic data recorder on a regular interval, usually every 15 minutes.
Diagram of a typical streamgage installation with equipment used to measure stream stage. (Credit: Althea Archer, USGS)
At some streamgage sites, a stilling well is not feasible or is not cost effective to install. As an alternative, stage can be determined by measuring the pressure required to maintain a small flow of gas through a tube and bubbled out at a fixed location under water in the stream (image to the right). The measured pressure is directly related to the height of water over the tube outlet in the stream. As the depth of water above the tube outlet increases, more pressure is required to push the gas bubbles through the tube.
Data collection and transmission follow a dynamic schedule.
Recording frequency - Stage is typically recorded every 15 minutes but can be as short as every 5 minutes during rapid rises caused by intense rainfall and runoff.
Data transmission - Data are transmitted by satellite to USGS servers every 1 to 4 hours. During periods of high water or emergency situations, transmission frequency increases to every 15 minutes to provide more timely information.
Stage measurements are precise, typically accurate to within ±0.01 foot or 0.2 percent of the effective stage.
Diagram of channel cross section with subsections. Subsection width is generally measured using a cable, steel tape, or similar piece of equipment. Subsection depth is measured using a wading rod, if conditions permit, or by suspending a sounding weight from a calibrated cable and reel system off a bridge, cableway, or boat or through a hole drilled in ice. (Credit: S.A. Olson and J.M. Norris, USGS)
Streamflow, or discharge, is the volume of water moving down a stream or river over a specific time and is commonly expressed in cubic feet per second (cfs) or gallons per day (gal/d). Because stream discharge cannot be measured directly, it must be computed from variables that can be measured directly, such as stream depth, stream width, and streamflow velocity. It is typically calculated by multiplying the cross-sectional area of water in a stream channel by the average velocity of the water in that cross section (see below). Although streamflow is computed from measurements of other variables, the terms “streamflow measurement” or “discharge measurement” are generally applied to the final result of the calculations.
Numerous types of equipment and methods are used by USGS personnel to make current-meter measurements because of the wide range of stream conditions throughout the United States. Two methods that are primarily used are:
Mechanical current-meter method - The stream channel cross section is divided into vertical subsections, and a current meter is used to estimate the velocity in each subsection. As water flows past the meter, a wheel of metal cups rotates. The speedof these rotations is electronically timed and translated into velocity for each section. Subsection velocities are multiplied by corresponding subsection areas and the values summed to compute total discharge for the cross section.
Acoustic Doppler Current Profiler (ADCP) method - ADCPs are modern hydroacoustic instruments that use sound pulses to measure velocity using the principles of the Doppler Effect. By measuring the frequency shift of sound reflecting off particles in the water, the ADCP creates a highly accurate, continuous profile of both water speed and direction across the entire channel.
A hydrologic technician conducts a measurement in a stream using a mechanical current meter. An electronic signal is transmitted by the meter on each revolution allowing the revolutions to be counted and timed. Because the rate at which the cups revolve is directly related to the velocity of the water, the timed revolutions are used to determine the water velocity.
A USGS hydrographer makes an acoustic streamflow measurement from a cableway at streamgage 10308200 East Fork Carson River below Markleeville Creek, near Markleeville, CA. To make a discharge measurement, the ADCP is mounted onto a boat or into a small watercraft (diagram above) with its acoustic beams directed into the water from the water surface. The ADCP is then guided across the surface of the river to obtain measurements of velocity and depth across the channel. The river-bottom tracking capability of the ADCP acoustic beams or a Global Positioning System (GPS) is used to track the progress of the ADCP across the channel and provide channel-width measurements.
Example of a rating curve showing the relation between stage and discharge.
A stage-discharge rating curve depicts the relation between stream stage and stream discharge at a location along a stream, generally at a streamgage. Each point on a stage-discharge graph represents one discharge measurement. Because every stream has a unique channel shape, size, slope, and even channel roughness, every rating curve is site-specific.
Keeping rating curves accurate and up-to-date is important. Key aspects of maintaining rating curves include:
Data collection - Rating curves are developed from numerous discharge measurements collected over a period of time, and varying conditions, from droughts to floods.
Frequent updates - Changes in a stream channel can impact the rating curve. Changes in stream channels are often caused by erosion or deposition of streambed materials, seasonal vegetation growth, debris, or ice. New discharge measurements plotted on an existing stage-discharge relation graph would show this, and the rating could be adjusted to allow the correct discharge to be estimated for the measured stage. USGS hydrographers visit each gage about once every 6 weeks to make a discharge measurement and measure high flows when they happen to ensure the curve remains accurate.
Continuous monitoring - USGS computers are used to apply the stream-discharge rating curve for a given streamgage to its continuous stage data to estimate discharge for the site.
For complex environments, like tidal rivers or flat areas where stage doesn't reliably predict flow, modern instrumentation has made it possible to continuously monitor discharge in these streams using the index velocity method. A hydroacoustic or ultrasonic velocity meter, installed in a river, monitors water speed continuously. These data are paired with cross-sectional area to calculate discharge even when traditional rating curves fail.
From the Stream to Your Screen - Streamflow Data on the Internet
Diagram of how streamgage data is transferred to the internet. (Credit: Althea Archer, USGS)
Over 135 years of high-quality water data for more than one million monitoring locations are accessible from Water Data for the Nation. Data users include emergency responders, water managers, environmental and transportation agencies, universities, utilities, recreational enthusiasts, and consulting firms. Key applications of USGS water data include:
Public safety - ensuring streams are safe for recreational activities and managing drinking water facilities
Hazard mitigation - planning, forecasting, and warning about floods and droughts
Environmental protection - monitoring aquatic habitats, assessing water quality, and regulating pollutants
Infrastructure and utilities - designing reservoirs, roads, bridges, and managing waterways for power production and navigation
Resource management - managing water rights and transboundary issues, and tracking impacts to streamflow from changing land and water uses
Screenshot of the Water Data for the Nation (WDFN) homepage. WDFN is the home for USGS's modernization of public delivery of water data. USGS water data can be accessed in many ways: Monitoring Location Pages provide a source of centralized water data, including graphs, stats, and tables of observed water real-time and historical data; interactive maps display real-time conditions and allow exploration; email and text alerts of real-time water conditions, Application Programming Interfaces (APIs); and software packages allow programmatic access.
Screenshot of the new Water Data for the Nation hydrograph for continuous monitoring locations.
How are new gage sites established?
The USGS can install a streamgage almost anywhere, but in most cases, we do not choose when and where to do that. We typically install and operate streamgages where other entities ask and reimburse us to do so.
USGS selects a suitable site along a river or stream and constructs a gage house to hold equipment that measures and records the height of the water surface (gage height or stage). The gage house also can hold equipment that measures water-quality parameters, such as temperature, pH, dissolved oxygen, and dissolved chemicals, and weather conditions, such as air temperature, precipitation, and wind speed.
If there is need for a streamgage in your area, reach out to a local government agency and ask them to contact the USGS about entering into an agreement to install and operate a new gage.
Below is other information associated with USGS streamgaging activities.
As of October 2024, the USGS Groundwater and Streamflow Information Program supports the collection and (or) delivery of both streamflow and water-level information at 8,705 sites and water-level information alone at 3,460 additional sites. The data are served online—most in near real-time—to meet many diverse needs including the protection of life, property, the environment, and our economy.
As of October 2024, the USGS Groundwater and Streamflow Information Program supports the collection and (or) delivery of both streamflow and water-level information at 8,705 sites and water-level information alone at 3,460 additional sites. The data are served online—most in near real-time—to meet many diverse needs including the protection of life, property, the environment, and our economy.
Federal Priority Streamgages (FPS) are automated stations that monitor water conditions in streams and rivers throughout the country. Originally established in 1999, these are important for meeting specific long-term needs of the Nation. The FPS Network was recently re-prioritized which resulted in size of the network increasing to nearly 12,400 locations.
Federal Priority Streamgages (FPS) are automated stations that monitor water conditions in streams and rivers throughout the country. Originally established in 1999, these are important for meeting specific long-term needs of the Nation. The FPS Network was recently re-prioritized which resulted in size of the network increasing to nearly 12,400 locations.
To manage our water resources effectively, we need to understand how much water is available and its usefulness. The USGS monitors the nation’s water resources through various national observing networks that use a range of technologies and methods to assess real-time water conditions and predict future changes in water availability for human and ecological uses.
To manage our water resources effectively, we need to understand how much water is available and its usefulness. The USGS monitors the nation’s water resources through various national observing networks that use a range of technologies and methods to assess real-time water conditions and predict future changes in water availability for human and ecological uses.
Rapid Deployment Gages (RDGs) are fully-functional streamgages designed to be deployed quickly and temporarily to measure and transmit stream stage data in emergency situations.
Rapid Deployment Gages (RDGs) are fully-functional streamgages designed to be deployed quickly and temporarily to measure and transmit stream stage data in emergency situations.
During large coastal storms, the storm surge and waves are the main cause of destruction and landscape change, transporting saline water, sediment, and debris inland. The USGS, in collaboration with stakeholders, has constructed a national Surge, Wave, and Tide Hydrodynamics (SWaTH) Network for the Atlantic, Eastern Pacific, and Central Pacific. SWaTH monitors and documents the height, extent, and...
Surge, Wave, and Tide Hydrodynamics (SWaTH) Network
During large coastal storms, the storm surge and waves are the main cause of destruction and landscape change, transporting saline water, sediment, and debris inland. The USGS, in collaboration with stakeholders, has constructed a national Surge, Wave, and Tide Hydrodynamics (SWaTH) Network for the Atlantic, Eastern Pacific, and Central Pacific. SWaTH monitors and documents the height, extent, and...
The USGS collects water data daily across the U.S. using sensors that automatically sample the data at set intervals. We have over 11,000 of these devices, known as gages, in our nationwide network.
The data from these gages are used in decision-making at all levels, from recreationists to congresspersons.
The USGS collects water data daily across the U.S. using sensors that automatically sample the data at set intervals. We have over 11,000 of these devices, known as gages, in our nationwide network.
The data from these gages are used in decision-making at all levels, from recreationists to congresspersons.
Whether you drink water from your tap, use electricity or canoe down your local river, chances are you benefit from USGS streamgage information. So what is a streamgage and what does it do for you? This CoreCast episode gives you the inside scoop on your silent superhero.
Whether you drink water from your tap, use electricity or canoe down your local river, chances are you benefit from USGS streamgage information. So what is a streamgage and what does it do for you? This CoreCast episode gives you the inside scoop on your silent superhero.
Information on the flow of rivers and streams is a vital national asset that safeguards lives, protects property, and ensures adequate water supplies for the future. The U.S. Geological Survey (USGS) operates a network of more than 9,000 streamgages nationwide with more than 500 in Texas.
The U.S. Geological Survey (USGS) operated 12,165 continuous surface-water monitoring locations (streamgages) across the United States in 2024. The streamgages provide information on river height and streamflow, typically at 15-minute intervals. This information is then made available to everyone, most of it delivered nearly in realtime on the USGS National Water Dashboard.
The U.S. Geological Survey (USGS) operated 11,850 continuous surface-water monitoring locations (streamgages) across the United States in 2023. The streamgages provide information on river height and streamflow, typically at 15-minute intervals. This information is then made available to everyone, most of it delivered nearly in realtime on the USGS National Water Dashboard.
The Federal Priority Streamgage (FPS) network of the U.S. Geological Survey (USGS), created in 1999 as the National Streamflow Information Program, receives Congressional appropriations to support the operation of a federally-funded “backbone” network of streamflow gages across the United States that are designated to meet the “Federal needs” or priorities of the country. Anticipating...
Authors
Jonathan J.A. Dillow, Brian E. McCallum, Cory E. Angeroth
In the late 1800s, John Wesley Powell, second Director of the U.S. Geological Survey (USGS), proposed gaging the flow of rivers and streams in the Western United States to evaluate the potential for irrigation. Around the same time, several cities in the Eastern United States established primitive streamgages to help design water-supply systems. Streamgaging technology has greatly...
Authors
Sandra M. Eberts, Michael D. Woodside, Mark N. Landers, Chad R. Wagner
Application of the index velocity method for computing continuous records of discharge has become increasingly common, especially since the introduction of low-cost acoustic Doppler velocity meters (ADVMs) in 1997. Presently (2011), the index velocity method is being used to compute discharge records for approximately 470 gaging stations operated and maintained by the U.S. Geological...
The techniques used in making discharge measurements at gaging stations are described in this report. Most of the report deals with the current-meter method of measuring discharge, because this is the principal method used in gaging streams. The use of portable weirs and flumes, floats, and volumetric tanks in measuring discharge are briefly described.
Continuous measurements of stream stage are used in determining records of stream discharge. In addition a record of stream stage is useful in itself, as in designing structures affected by stream elevation or in planning the use of flood plains. This report describes instruments and structures commonly used in obtaining a record of stream stage.
The National Water Dashboard (NWD) is a mobile, interactive tool that provides real-time information on water levels, weather, and flood forecasts - all in one place on a computer, smartphone, or other mobile device. The NWD presents real-time stream, lake and reservoir, precipitation, and groundwater data from more than 13,500 USGS observation stations across the country.
This site is the home for modernized access to USGS water data in machine-readable formats via REST APIs, a common type of web service programs use to search and download data. These services provide USGS water data, ranging from continuous measurements of streamflow to information about individual USGS sites and more.
Water information is fundamental to national and local economic well-being, protection of life and property, and effective management of the Nation’s water resources. The Water Data Blog posts highlight water data developments, data, and applications.
The U.S. Geological Survey WaterAlert service provides notifications to your email or phone for changes in water conditions based on thresholds you choose.
This mapper identifies USGS Federal Priority Streamgages (FPS). FPS are monitoring stations that track the amount of water in streams and rivers across the Nation to meet long-term federal information needs. They are strategically positioned to serve as a backbone for the larger National Streamflow Network that is operated in cooperation with over 1,200 federal, state, tribal, and local agencies.
The USGS has been measuring streamflow since 1889. Explore how USGS streamgages have been supporting our Nation's changing water-resource needs and priorities for 130 years in an interactive data visualization story.
This mapper identifies USGS streamgages that are in danger of being discontinued or converted to a reduced level of service due to lack of funding, gages that already have been discontinued, and gages that have been ‘rescued’ by a new funding source.
Information on the flow of rivers is a vital national asset that safeguards lives, protects property, and ensures adequate water supplies for the future. The USGS is the federal agency responsible for operating a network of about 7,000 streamgages nationwide. Data from this network are used by water managers, emergency responders, utilities, environmental agencies, universities, consulting firms...
Information on the flow of rivers is a vital national asset that safeguards lives, protects property, and ensures adequate water supplies for the future. The USGS is the federal agency responsible for operating a network of about 7,000 streamgages nationwide. Data from this network are used by water managers, emergency responders, utilities, environmental agencies, universities, consulting firms...
Streams are like living things and are constantly changing. Sometimes streams erode, becoming deeper, while other times streams deposit sediment, becoming shallower. To understand how those changes can affect streamflow, we need to measure from a reference point that does not change over time, which is why gage datums are chosen to be below the base of a streambed. This means that the gage datum...
Why doesn’t USGS measure gage height from the bottom of the stream?
Streams are like living things and are constantly changing. Sometimes streams erode, becoming deeper, while other times streams deposit sediment, becoming shallower. To understand how those changes can affect streamflow, we need to measure from a reference point that does not change over time, which is why gage datums are chosen to be below the base of a streambed. This means that the gage datum...
The USGS can install a streamgage almost anywhere, but in most cases we do not choose when and where to do that. We typically install and operate streamgages where other entities ask and reimburse us to do so. We operate streamgages for entities such as cities, towns, counties, state agencies, and other federal agencies to assist with their missions and to provide data for general public use...
The USGS can install a streamgage almost anywhere, but in most cases we do not choose when and where to do that. We typically install and operate streamgages where other entities ask and reimburse us to do so. We operate streamgages for entities such as cities, towns, counties, state agencies, and other federal agencies to assist with their missions and to provide data for general public use...
There can be occasional equipment or database problems where erroneous data are reported for short periods of time until corrections can be made. This is why it is important to look at a record of streamflow (like the 7-day hydrograph plots) rather than a single point in time. However, most of the time the USGS has a high level of confidence in its real-time stage data. During low streamflow...
Sometimes the USGS real-time stage data seems too high (or too low). Are the USGS data inaccurate?
There can be occasional equipment or database problems where erroneous data are reported for short periods of time until corrections can be made. This is why it is important to look at a record of streamflow (like the 7-day hydrograph plots) rather than a single point in time. However, most of the time the USGS has a high level of confidence in its real-time stage data. During low streamflow...
Stream stage (aka gage height) is an important concept when analyzing how much water is moving in a stream at any given moment. "Stage" is the water level above some arbitrary point in the river and is commonly measured in feet. For example, on a normal day when no rain has fallen for a while, a river might have a stage of 2 feet. If a big storm hits, the river stage could rise to 15 or 20 feet...
Stream stage (aka gage height) is an important concept when analyzing how much water is moving in a stream at any given moment. "Stage" is the water level above some arbitrary point in the river and is commonly measured in feet. For example, on a normal day when no rain has fallen for a while, a river might have a stage of 2 feet. If a big storm hits, the river stage could rise to 15 or 20 feet...
Not directly. You cannot say that because a stream rises (doubles) from a 10-foot stage to a 20-foot stage that the amount of flowing water also doubles. Think of a cereal bowl with a rounded bottom. Pour one inch of milk in it. It doesn't take much milk to make it up to the one inch level because the bowl is at its narrowest near the bottom. Now, pour in milk until it is two inches deep -- it...
Does "stage" tell you how much water is flowing in a stream?
Not directly. You cannot say that because a stream rises (doubles) from a 10-foot stage to a 20-foot stage that the amount of flowing water also doubles. Think of a cereal bowl with a rounded bottom. Pour one inch of milk in it. It doesn't take much milk to make it up to the one inch level because the bowl is at its narrowest near the bottom. Now, pour in milk until it is two inches deep -- it...
USGS real-time streamflow data are typically recorded at 15-minute intervals, stored onsite, and then transmitted to USGS offices once every hour, depending on the data relay technique used. Recording and transmission times might be more frequent during critical events (floods, for example). Data from current sites are relayed to USGS offices via satellite, telephone, and/or radio telemetry and...
USGS real-time streamflow data are typically recorded at 15-minute intervals, stored onsite, and then transmitted to USGS offices once every hour, depending on the data relay technique used. Recording and transmission times might be more frequent during critical events (floods, for example). Data from current sites are relayed to USGS offices via satellite, telephone, and/or radio telemetry and...
The USGS usually corrects any equipment or station problems at our streamgages within a few days of their occurrence. Occasionally, replacement parts or equipment might not be readily available, or a station might be inaccessible due to weather conditions. Most USGS streamgaging stations are operated in cooperation with other agencies. At some stations, the stage transmitting equipment is owned...
Why do some real-time streamgaging stations stop transmitting data for extended periods of time?
The USGS usually corrects any equipment or station problems at our streamgages within a few days of their occurrence. Occasionally, replacement parts or equipment might not be readily available, or a station might be inaccessible due to weather conditions. Most USGS streamgaging stations are operated in cooperation with other agencies. At some stations, the stage transmitting equipment is owned...
In order to convert gage height (or "stage", usually expressed as feet) into streamflow (or "discharge", usually expressed as cubic feet per second), USGS hydrographers must establish a relationship between them. This stage-discharge relationship is called a rating curve. It’s developed by making frequent manual discrete discharge measurements at stream gaging stations. The rating curve depends on...
How is a rating curve used to convert gage height into streamflow?
In order to convert gage height (or "stage", usually expressed as feet) into streamflow (or "discharge", usually expressed as cubic feet per second), USGS hydrographers must establish a relationship between them. This stage-discharge relationship is called a rating curve. It’s developed by making frequent manual discrete discharge measurements at stream gaging stations. The rating curve depends on...
Water Data for the Nation (WDFN) is the home for USGS streamflow, groundwater, and water quality data. Through WDFN you can find different tools to look at historic and real-time streamflow data, find sites of interest, and access using USGS water data application programming interfaces (APIs). State pages (e.g., California) allow you to discover real-time data in your state, or you can create a...
Where can I get real-time and historical streamflow information?
Water Data for the Nation (WDFN) is the home for USGS streamflow, groundwater, and water quality data. Through WDFN you can find different tools to look at historic and real-time streamflow data, find sites of interest, and access using USGS water data application programming interfaces (APIs). State pages (e.g., California) allow you to discover real-time data in your state, or you can create a...