


Phragmites invades coastal wetland in a changing climate
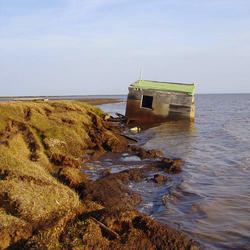
Phragmites invades coastal wetland in a changing climatePhragmites invades coastal wetland in a changing climate. Ottawa National Wildlife Refuge, Oak Harbor, OH. Photo Credit: Kurt Kowalski, USGS-GLSC.


