
A graphic showing the Antarctica Plateau where temperatures in several hollows can dip below minus 133.6 degrees F.
Images
The National Land Imaging Program supports a variety of geospatial data programs and projects, including the USGS Landsat Program. Browse the images below to see some of the imagery produced using NLI-supported data sources.
Filter Total Items: 508

National Snow and Ice Data Center
A graphic showing the Antarctica Plateau where temperatures in several hollows can dip below minus 133.6 degrees F.

Salty Desolation
A vast, open expanse in Namibia is one of the largest salt pans in the world. The pan is within Etosha National Park, protected since 1907. The horizontal line across the image is the national park fence. The wild patterns in this infrared interpretation are from numerous episodes of water evaporation following seasonal rains.
A vast, open expanse in Namibia is one of the largest salt pans in the world. The pan is within Etosha National Park, protected since 1907. The horizontal line across the image is the national park fence. The wild patterns in this infrared interpretation are from numerous episodes of water evaporation following seasonal rains.
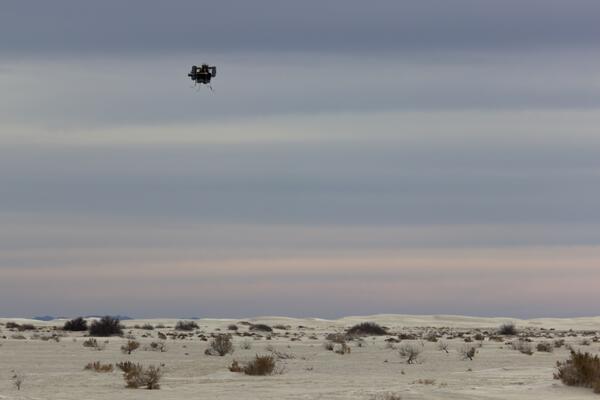
UAS in flight at the White Sands National Monument
UAS in flight at the White Sands National MonumentUAS in flight at the White Sands National Monument
UAS in flight at the White Sands National Monument
UAS in flight at the White Sands National MonumentUAS in flight at the White Sands National Monument

Nevada Landsat State Mosaic
Nevada was the fastest growing state between 1990 and 2000, with a population growth rate of 66.3 percent. No other state topped 40 percent.
Capital Carson City
Image Source Landsat 8
Population 3,104,614
Number of Pixels 318,192,547
Nevada was the fastest growing state between 1990 and 2000, with a population growth rate of 66.3 percent. No other state topped 40 percent.
Capital Carson City
Image Source Landsat 8
Population 3,104,614
Number of Pixels 318,192,547

Landsat 8-artist rendering
Artist's rendering of Landsat Data Continuity Mission (LDCM). The satellite was renamed Landsat 8 after a successful launch on February 11, 2013.
Visit this Landsat 8 webpage to learn more about the Landsat program.
Artist's rendering of Landsat Data Continuity Mission (LDCM). The satellite was renamed Landsat 8 after a successful launch on February 11, 2013.
Visit this Landsat 8 webpage to learn more about the Landsat program.
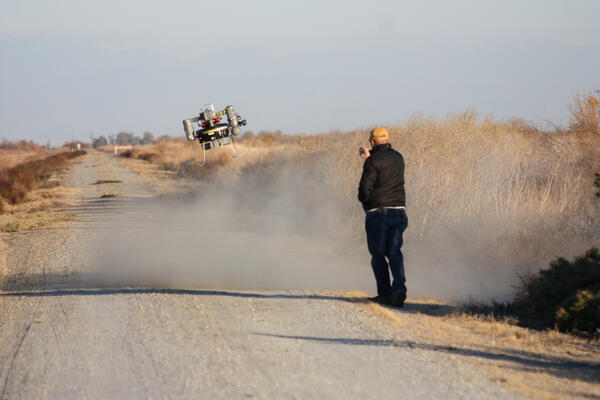
USGS scientist observing a UAS launch at the Pixley National Wildlife Refuge
USGS scientist observing a UAS launch at the Pixley National Wildlife RefugeUSGS scientist observing a UAS launch at the Pixley National Wildlife Refuge
In December 2013 NUSO scientists, in coordination with the USFWS, tested the feasibility of using UAS for waterbird surveys, waterbird species differentiation, and night-time thermal imagery collection at the Pixley NWR.

Juneau Icefield
This image also provides a clear view of the Juneau Icefield. Several glaciers flow from this icefield, and glaciologists are using the 42-year Landsat archive to monitor the advance and retreat of the glaciers over time.
This image also provides a clear view of the Juneau Icefield. Several glaciers flow from this icefield, and glaciologists are using the 42-year Landsat archive to monitor the advance and retreat of the glaciers over time.

Enhanced Landsat 8 Image of Western Australia
This image is a portion of the first Landsat 8 scene acquired May 12, 2013 (Path 107, Rows 70-71) in Western Australia. Geoscience Australia, a Landsat International Cooperator and a Landsat Science Team member, produced this enhanced image. Water and land were masked, separately enhanced, and then reassembled.
This image is a portion of the first Landsat 8 scene acquired May 12, 2013 (Path 107, Rows 70-71) in Western Australia. Geoscience Australia, a Landsat International Cooperator and a Landsat Science Team member, produced this enhanced image. Water and land were masked, separately enhanced, and then reassembled.

Landsat 7 Path 38 Row 31, Acquired March 29, 2013
On March 29-30, 2013, the Landsat Data Continuity Mission (later named Landsat 8) was in position under the Landsat 7 satellite. This provided opportunities for near-coincident data collection from both satellites.
On March 29-30, 2013, the Landsat Data Continuity Mission (later named Landsat 8) was in position under the Landsat 7 satellite. This provided opportunities for near-coincident data collection from both satellites.

Landsat 7 Path 38 Row 35, Acquired March 29, 2013
On March 29-30, 2013, the Landsat Data Continuity Mission (later named Landsat 8) was in position under the Landsat 7 satellite. This provided opportunities for near-coincident data collection from both satellites.
On March 29-30, 2013, the Landsat Data Continuity Mission (later named Landsat 8) was in position under the Landsat 7 satellite. This provided opportunities for near-coincident data collection from both satellites.

Landsat 8 Path 38 Row 35, Acquired March 29, 2013
On March 29-30, 2013, the Landsat Data Continuity Mission (later named Landsat 8) was in position under the Landsat 7 satellite. This provided opportunities for near-coincident data collection from both satellites.
On March 29-30, 2013, the Landsat Data Continuity Mission (later named Landsat 8) was in position under the Landsat 7 satellite. This provided opportunities for near-coincident data collection from both satellites.

Boulder, Colorado - Landsat 8
Landsat 8’s first image captured the area where the Great Plains and Rocky Mountains meet in Colorado in March 2013. The natural-color image shows the coniferous forest of the mountains coming down to the dormant plains. Boulder, Colorado, sits in the middle of the image.
Landsat 8’s first image captured the area where the Great Plains and Rocky Mountains meet in Colorado in March 2013. The natural-color image shows the coniferous forest of the mountains coming down to the dormant plains. Boulder, Colorado, sits in the middle of the image.

Landsat 5 MSS Image of Michigan’s Upper Peninsula
This image of Michigan’s Upper Peninsula was captured by the Multispectral Scanner (MSS) instrument onboard the Landsat 5 satellite on January 7, 2013.
This image of Michigan’s Upper Peninsula was captured by the Multispectral Scanner (MSS) instrument onboard the Landsat 5 satellite on January 7, 2013.

Remote Sensing Activities Report
Remote Sensing Activities Report front cover graphic for report.
Remote Sensing Activities Report front cover graphic for report.
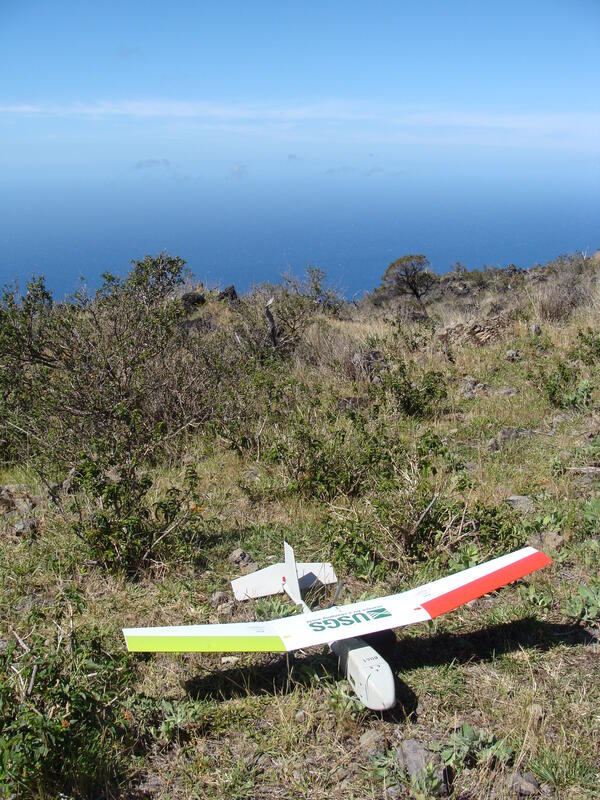
Fixed wing UAS at the Haleakala National Park in Hawaii
Fixed wing UAS at the Haleakala National Park in HawaiiFixed wing UAS at the Haleakala National Park in Hawaii in May 2012 where NUSO remote pilots worked with the National Park Service to test UAS’ ability to map invasive plants and inspect fence lines in remote inaccessible areas of the park.

Landsat 5 Captures MSS Data
The Multispectral Scanner (MSS) on board Landsat 5 satellite captured imagery of the southern Louisiana coastline on April 10, 2012, after the sensor was turned back on after being off for nearly a dozen years. This image is a portion of the scene from WRS-2 Path 23 Row 40. The MSS sensor collected nearly 15,000 scenes from 2012 to January 7, 2013.
The Multispectral Scanner (MSS) on board Landsat 5 satellite captured imagery of the southern Louisiana coastline on April 10, 2012, after the sensor was turned back on after being off for nearly a dozen years. This image is a portion of the scene from WRS-2 Path 23 Row 40. The MSS sensor collected nearly 15,000 scenes from 2012 to January 7, 2013.

USGS scientist hand launching a fixed wing UAS
USGS scientist Jeff Sloan hand launching a fixed wing UAS during a 2011 NUSO research mission, in coordination with the Office of Surface Mining, at the Powellton Surface Mine in West Virginia to test the utility of UAS technology for supporting coal mining inspection and oversight.
USGS scientist Jeff Sloan hand launching a fixed wing UAS during a 2011 NUSO research mission, in coordination with the Office of Surface Mining, at the Powellton Surface Mine in West Virginia to test the utility of UAS technology for supporting coal mining inspection and oversight.
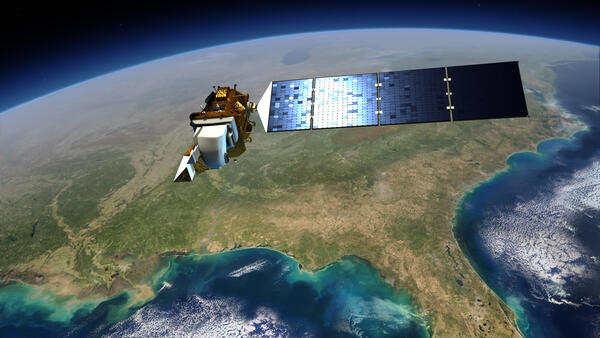
Image of Landsat 8 over the US
This illustration shows the Landsat 8 satellite in space over the southeastern United States.
This illustration shows the Landsat 8 satellite in space over the southeastern United States.

Landsat Photo: Wallow Fire, Arizona
This Landsat imagery was taken on June 7, 2011. Path/Row: 35/36 and 37 Lat/Long: 33.820/-109.330
This Landsat imagery was taken on June 7, 2011. Path/Row: 35/36 and 37 Lat/Long: 33.820/-109.330

Tuscaloosa-Birmingham Tornado Scar, April 2011
The roughly west-east trail of destruction from the April 27, 2011, Tuscaloosa-Birmingham tornado is clearly visible in these Landsat images. This was one of 358 recorded tornadoes during the April 25-28, 2011, tornado outbreak, the most severe in U.S. history.
The roughly west-east trail of destruction from the April 27, 2011, Tuscaloosa-Birmingham tornado is clearly visible in these Landsat images. This was one of 358 recorded tornadoes during the April 25-28, 2011, tornado outbreak, the most severe in U.S. history.

Example of the Landsat Collection 2 Fractional Snow Covered Snow Science Product
Example of the Landsat Collection 2 Fractional Snow Covered Snow Science ProductExample of the Landsat Collection 2 Fractional Snow Covered Area (fSCA) Science Product showing an area in the Dixie National Forest in Utah on February 28, 2021 for tile h007V010. Left: Landsat Collection 2 U.S. Analysis Ready Data Surface Reflectance image, Middle: fSCA, and Right: Canopy Adjusted fSCA.