
Integrated Water Availability Assessments Fundamentals
USGS releases a comprehensive look at water resources in the United States
New National Water Availability Assessment offers critical insights into water supply, demand, and quality across the Nation.
Water Priorities for the Nation: IWAAs
Factsheet outlines the goals and deliverables of the Integrated Water Availability Assessments Program
The USGS Water Resources Mission Area is assessing how much water is available for human and ecological needs in the United States and identifying where and when the Nation may have challenges meeting its demand for water.
Visit the new National Water Availability Assessment website

Learn more about how USGS is assessing how much water is available for human and ecological needs, including the new National Water Availability Assessment!
National Water Availability Assessment
The USGS National Water Availability Assessment consists of reports, which provide a scientific summary and interpretation of water quantity, quality and use, and the data companion, which delivers model-based estimates of water supply and demand.
Integrated Water Availability Assessments produced by the USGS Water Resources Mission Area (WMA) will provide estimates of water supply and demand in the past, present, and future. These assessments, or studies with an emphasis on quantifying and understanding water availability, will investigate historical changes in water supply and demand and their causes, and help us identify where and when the Nation may have challenges meeting its demand for water because of insufficient water quantity or quality. Understanding water supply and demand will support better and more efficient water management for economic growth, protection of aquatic ecosystems, agriculture and energy production, and human population growth. These assessments will also support adaptive management in areas of emerging imbalance between water supply and demand.
Three high priority outcomes on water availability
The Water Resources Mission Area has identified three priority products for our assessment of water availability. These three products are designed to be interdependent.
- National Water Availability Assessment Reports
- Activities in the Regional Water Availability Assessments will provide detailed and variable case studies to help explain national patterns identified in the National Water Availability Assessment reports.
- National Water Availability Assessment Data Companion
- Models underpinning the National Water Availability Assessment Data Companion (NWDC) will be used for interpretation in the National Water Availability Assessment reports.
- Regional Water Availability Assessments
- Activities in each Regional Water Availability Assessment will help fill gaps in national models, improving future versions of the National Water Availability Assessment Data Companion (NWDC).
National Water Availability Assessment Report
The National Water Availability Assessments will provide the synthesis and interpretation of water availability in the past, present, and future. These assessments will be modeled in part after the previous national assessments conducted by the Water Resources Council in the 1960s and 1970s. They will also build on more recent reporting by the USGS on national water use and water quality conducted through the WMA’s Water Availability and Use Program and the former National Water Quality Assessment (NAWQA) program. These new assessments will include more model predictions, allowing us to fill in spatial and temporal gaps in our monitoring records; evaluate water quantity, quality, and use at the same time; and make forecasts into the future.
The National Water Availability Assessments will also provide insights into regional and topical aspects of water availability. For example, the National Water Availability Assessments may use results from the Regional Water Availability Assessments to better understand the behavior of individual water-availability components and help explain broader regional and national patterns. The National Water Availability Assessment reports may also consider topical issues that cut across multiple components of water availability, such as wildfire and its effects on water quantity, quality, and use.
Because of the large scope of the National Water Availability Assessments, they will be produced on a five-year cycle to allow enough time for generation of new information, synthesis, interpretation, review, and publication. Additional products that are smaller in scope, like data visualizations, short topical summaries, and journal articles, will be released in the years between the national assessments.
National Water Availability Assessment Data Companion
The National Water Availability Assessment Data Companion (NWDC) will provide regularly updated online information about water quantity, quality, and use of the Nation’s surface and groundwater. The information in the National Water Availability Assessment Data Companion (NWDC) will cover past conditions over multiple decades as well as future projections over multiple decades. This centralized delivery of model and trend information will complement the centralized delivery of observational data in USGS Water Data for the Nation (WDFN).
The National Water Availability Assessment Data Companion (NWDC) will allow people outside USGS to use webservices and APIs to pull data and model predictions into their own models, map viewers, and other tools. It also will allow users to interactively visualize and explore the data online through mappers and dashboards.
Regional Water Availability Assessments
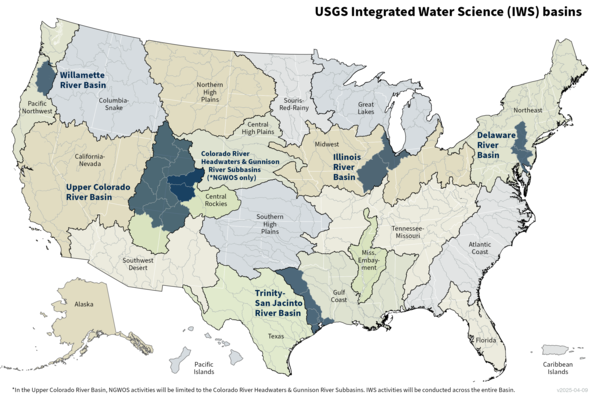
Regional Water Availability Assessments will be conducted in medium-sized watersheds that are representative of larger regions throughout the Nation. These assessments are designed to capture a range of conditions in major drivers of water availability. Some regional water availability assessments occur in Integrated Water Science Basins, which represent a wide range of environmental, hydrologic, and landscape settings and human stressors of water resources. Models, tools, and supporting data developed for the National Water Availability Assessment Data Companion and National Water Availability Assessments will provide a starting point for the Regional Water Availability Assessments. In turn, the regions will provide a test bed for innovative methods and approaches in data collection, trend analysis, research, model development, and assessment of water availability. These innovations will be designed to inform the Regional Water Availability Assessments and improve the accuracy of national models and assessments.
The Regional Water Availability Assessments have two main tasks:
- Focused assessments of regionally relevant threats to water availability. These assessments aim to address regionally important water-resource questions in ways that support local stakeholders and improve national assessment capacity
- Base evaluation of regional water supply and demand. USGS will conduct an integrated and comprehensive assessment of factors affecting water quantity, quality and use in each region. In addition, USGS aims to answer the same questions as the National Water Availability Assessments but with more detail and greater focus on the important regional water issues.
Below are other USGS science efforts related to National Water Availability Assessments.
Integrated Water Science Basins: Upper Colorado River

National Water Availability Assessments

Regional Water Availability Assessments

National Water Availability Assessment Reports

Integrated Water Science Basins: Willamette River
The USGS Water Resources Mission Area is assessing how much water is available for human and ecological needs in the United States and identifying where and when the Nation may have challenges meeting its demand for water.
Visit the new National Water Availability Assessment website
Learn more about how USGS is assessing how much water is available for human and ecological needs, including the new National Water Availability Assessment!
National Water Availability Assessment
The USGS National Water Availability Assessment consists of reports, which provide a scientific summary and interpretation of water quantity, quality and use, and the data companion, which delivers model-based estimates of water supply and demand.
Integrated Water Availability Assessments produced by the USGS Water Resources Mission Area (WMA) will provide estimates of water supply and demand in the past, present, and future. These assessments, or studies with an emphasis on quantifying and understanding water availability, will investigate historical changes in water supply and demand and their causes, and help us identify where and when the Nation may have challenges meeting its demand for water because of insufficient water quantity or quality. Understanding water supply and demand will support better and more efficient water management for economic growth, protection of aquatic ecosystems, agriculture and energy production, and human population growth. These assessments will also support adaptive management in areas of emerging imbalance between water supply and demand.
Three high priority outcomes on water availability
The Water Resources Mission Area has identified three priority products for our assessment of water availability. These three products are designed to be interdependent.
- National Water Availability Assessment Reports
- Activities in the Regional Water Availability Assessments will provide detailed and variable case studies to help explain national patterns identified in the National Water Availability Assessment reports.
- National Water Availability Assessment Data Companion
- Models underpinning the National Water Availability Assessment Data Companion (NWDC) will be used for interpretation in the National Water Availability Assessment reports.
- Regional Water Availability Assessments
- Activities in each Regional Water Availability Assessment will help fill gaps in national models, improving future versions of the National Water Availability Assessment Data Companion (NWDC).
National Water Availability Assessment Report
The National Water Availability Assessments will provide the synthesis and interpretation of water availability in the past, present, and future. These assessments will be modeled in part after the previous national assessments conducted by the Water Resources Council in the 1960s and 1970s. They will also build on more recent reporting by the USGS on national water use and water quality conducted through the WMA’s Water Availability and Use Program and the former National Water Quality Assessment (NAWQA) program. These new assessments will include more model predictions, allowing us to fill in spatial and temporal gaps in our monitoring records; evaluate water quantity, quality, and use at the same time; and make forecasts into the future.
The National Water Availability Assessments will also provide insights into regional and topical aspects of water availability. For example, the National Water Availability Assessments may use results from the Regional Water Availability Assessments to better understand the behavior of individual water-availability components and help explain broader regional and national patterns. The National Water Availability Assessment reports may also consider topical issues that cut across multiple components of water availability, such as wildfire and its effects on water quantity, quality, and use.
Because of the large scope of the National Water Availability Assessments, they will be produced on a five-year cycle to allow enough time for generation of new information, synthesis, interpretation, review, and publication. Additional products that are smaller in scope, like data visualizations, short topical summaries, and journal articles, will be released in the years between the national assessments.
National Water Availability Assessment Data Companion
The National Water Availability Assessment Data Companion (NWDC) will provide regularly updated online information about water quantity, quality, and use of the Nation’s surface and groundwater. The information in the National Water Availability Assessment Data Companion (NWDC) will cover past conditions over multiple decades as well as future projections over multiple decades. This centralized delivery of model and trend information will complement the centralized delivery of observational data in USGS Water Data for the Nation (WDFN).
The National Water Availability Assessment Data Companion (NWDC) will allow people outside USGS to use webservices and APIs to pull data and model predictions into their own models, map viewers, and other tools. It also will allow users to interactively visualize and explore the data online through mappers and dashboards.
Regional Water Availability Assessments
Regional Water Availability Assessments will be conducted in medium-sized watersheds that are representative of larger regions throughout the Nation. These assessments are designed to capture a range of conditions in major drivers of water availability. Some regional water availability assessments occur in Integrated Water Science Basins, which represent a wide range of environmental, hydrologic, and landscape settings and human stressors of water resources. Models, tools, and supporting data developed for the National Water Availability Assessment Data Companion and National Water Availability Assessments will provide a starting point for the Regional Water Availability Assessments. In turn, the regions will provide a test bed for innovative methods and approaches in data collection, trend analysis, research, model development, and assessment of water availability. These innovations will be designed to inform the Regional Water Availability Assessments and improve the accuracy of national models and assessments.
The Regional Water Availability Assessments have two main tasks:
- Focused assessments of regionally relevant threats to water availability. These assessments aim to address regionally important water-resource questions in ways that support local stakeholders and improve national assessment capacity
- Base evaluation of regional water supply and demand. USGS will conduct an integrated and comprehensive assessment of factors affecting water quantity, quality and use in each region. In addition, USGS aims to answer the same questions as the National Water Availability Assessments but with more detail and greater focus on the important regional water issues.
Below are other USGS science efforts related to National Water Availability Assessments.
Integrated Water Science Basins: Upper Colorado River
National Water Availability Assessments
Regional Water Availability Assessments
National Water Availability Assessment Reports