


These Landsat images show the lake at record high levels in 1986 and at a historic low elevation on July 3, 2022.
Water and Extreme Weather
Water, Water, Everywhere!
Whether it's flooding from thunderstorms, storm surge, or tsunamis… sometimes water goes where we don’t want it.
Whether it's flooding from thunderstorms, storm surge, or tsunamis… sometimes water goes where we don’t want it.
Water, Water, Everywhere... or Not!
Great Salt Lake website tracks historically low lake levels and ecosystem effects of prolonged drought.
Great Salt Lake website tracks historically low lake levels and ecosystem effects of prolonged drought.
Before, During, and After the Flames
New Wildland Fire Science Strategy outlines research, technologies, and best practices to support risk, detection, and recovery.
New Wildland Fire Science Strategy outlines research, technologies, and best practices to support risk, detection, and recovery.
Could You Outrun a Tsunami Wave?
Interactive map shows areas where O‘ahu, Hawai’i, residents could evacuate on foot.
Interactive map shows areas where O‘ahu, Hawai’i, residents could evacuate on foot.
Keeping Communities Safe When Hurricanes Approach
USGS science provides response partners with crucial information about hurricane water levels, storm surge, coastal erosion, floodwater extent, and more.
USGS science provides response partners with crucial information about hurricane water levels, storm surge, coastal erosion, floodwater extent, and more.
Water is essential for all life on Earth, but too much water – or too little – can cause big problems. The USGS studies a wide range of water-related hazards, from large storms and flooding to drought and post-wildfire runoff, and helps communities plan for and respond to water-related emergencies.
National Water Dashboard
National Water Dashboard

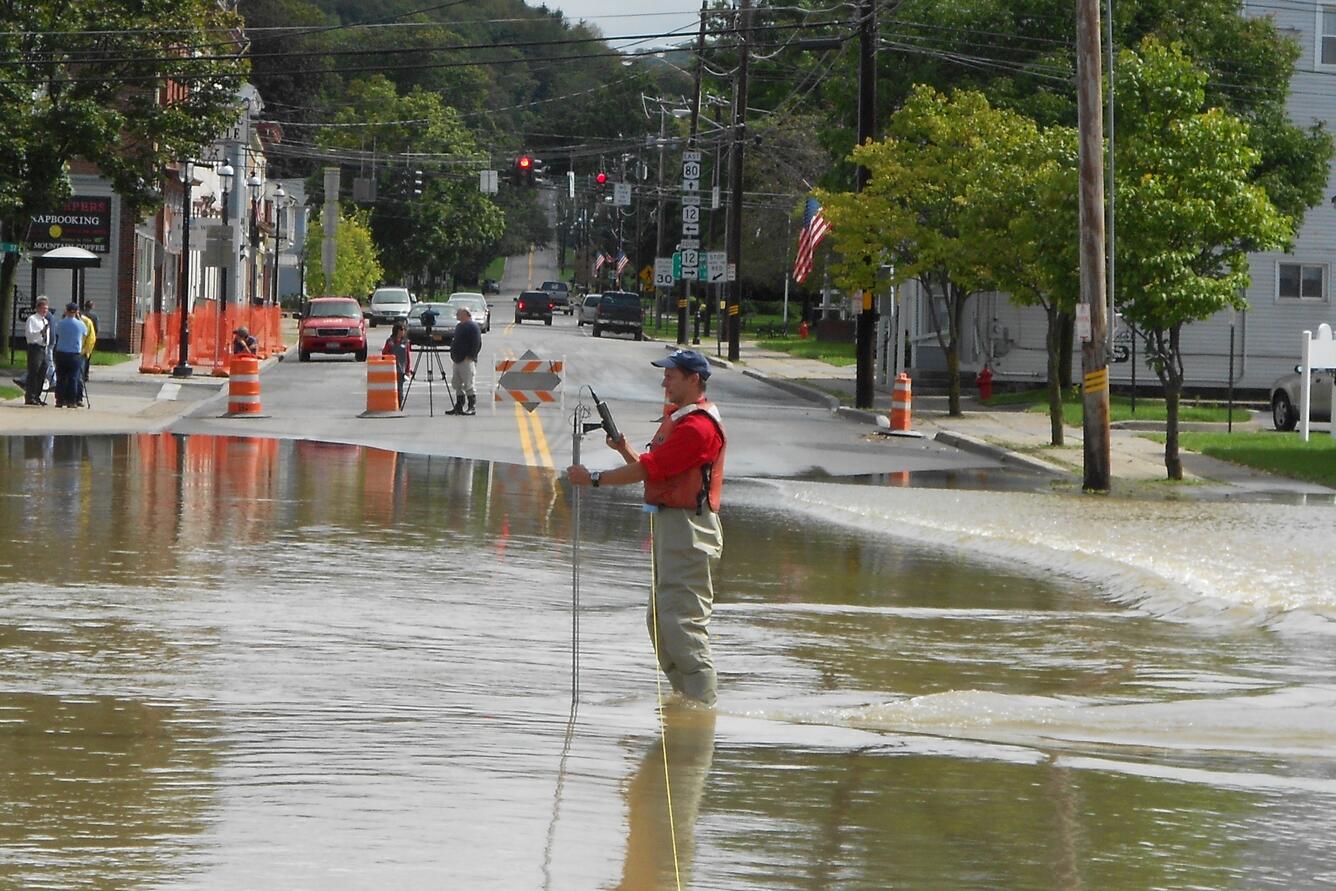
When responding to a water event, it’s important to know where the water is. The USGS National Water Dashboard is a mobile, interactive tool that provides real-time information on water levels, weather, and flood forecasts.
From Snow to Flow: What Changing Snowmelt Means for Water in the Western U.S.
From Snow to Flow: What Changing Snowmelt Means for Water in the Western U.S.

A majority of the water in the western U.S. comes from snowmelt, but changes in the timing, magnitude, and duration of snowmelt can alter water availability downstream. See what changing snowmelt means for water in the West, and how new USGS efforts can advance snow science.
Examples of USGS Water and Extreme Weather Science
Examples of USGS Water and Extreme Weather Science
Water covers roughly 70 percent of the Earth’s surface and is the single most powerful driver for changing the landscape of the planet. Regardless of where in the water cycle the element sits, water and extreme weather can be disastrous. Intense storms can trigger landslides, flood low-lying areas, or create fast-moving rivers that can wipe out bridges and buildings. Extreme drought can lead to wildfires, poor water quality, and water scarcity. Climate change is affecting precipitation patterns and increasing weather extremes. By monitoring and studying water and extreme weather, we can improve our ability to protect lives, property, and natural resources when emergencies happen.
Innovative Solutions for Challenging Hazards
Water-related hazards can happen anywhere, but it’s impossible to collect on-the-ground data everywhere. Using new technologies like remote sensing, drones, artificial intelligence, and non-contact streamgages, we can keep the data flowing in previously unmonitored locations – and where it's too dangerous for people to go.
Hazards can often have complex and interrelated relationships – an earthquake can cause a tsunami, which in turn can cause inland flooding. An atmospheric river over a drought-stricken region can cause severe flooding, erosion, and mudslides. Because the USGS studies such a wide variety of hazards, our scientists can collaborate to study how multiple hazards interact, which can improve our ability to forecast and respond to multi-hazard events.


Sources/Usage: Public Domain. View Media Details
National Research Supports Local Response
As a federal science agency, the USGS is uniquely positioned to study water hazards that cross multiple states and regions. We can model water availability and stream statistics across the entire Nation. We can forecast coastal erosion along the entire East Coast. We can monitor flooding as hurricanes track from the Gulf Coast into inland states. We can transfer staff and equipment from one region to another when disaster strikes. We can use what we learn in one area of the country to help inform another. And all of our science and data is available to any local community or individual who needs it.
When it comes to water and extreme weather hazards, the USGS doesn't work alone – we support many federal, state, and local partners by providing real-time data and scientific expertise, deploying specialized instrumentation, and helping understand causes and effects once the event is over. Collaboration is crucial for responding to widespread threats like flooding, fires, and drought.
Science
Did we start the fire? Climate, Fire and Humans
The past decade encompasses some of the most extensive fire activity in recorded history. An area the size of Vermont (~24,000 km2) burned in a single Siberian fire in the summer of 2019 (Kehrwald et al., 2020 and references therein) while Australia, Indonesia and the Amazon have all experienced their most intense fires in recorded history (van Wees et al, 2021 and references therein). As more...
USGS Snow and Avalanche Project
Snow avalanches are a widespread natural hazard to humans and infrastructure as well as an important landscape disturbance affecting mountain ecosystems. Forecasting avalanche frequency is challenging on various spatial and temporal scales, and this project aims to fill a gap in snow science by focusing on reconstructing avalanche history on the continental mountain range scale - throughout the...
Tsunami and Earthquake Research
Here you will find general information on the science behind tsunami generation, computer animations of tsunamis, and summaries of past field studies.
Atmospheric Warming, Loss of Snow Cover, and Declining Colorado River Flow
Declining snow cover is playing a key role in decreasing the flow of the Colorado River, “the lifeblood of the Southwest,” by enabling increased evaporation. As the warming continues, increasingly severe water shortages are expected.
Using Drone Imagery to Assess Impacts of the 2018 Carr Fire
USGS WERC’s Dr. Karen Thorne and her research team are using drone imagery to understand how the 2018 Carr Fire affected ecosystems and cultural resources. The study, a collaboration with the National Park Service (NPS), focuses on Whiskeytown National Recreation Area in northern California. The drone images will help the WERC researchers identify changes in topography, cultural sites, debris...
Multimedia
These Landsat images show the lake at record high levels in 1986 and at a historic low elevation on July 3, 2022.

USGS streamgage 05430500 Rock River at Afton, WI webcam timelapse (January 2022)
Timelapse of webcam images taken at USGS streamgage 05430500 Rock River at Afton, WI during January 2022. Current webcam imagery for this site is available on the USGS HIVIS website.
Timelapse of webcam images taken at USGS streamgage 05430500 Rock River at Afton, WI during January 2022. Current webcam imagery for this site is available on the USGS HIVIS website.

USGS responds to busy 2021 Atlantic hurricane Season
The 2021 Atlantic hurricane season was the third most-active season on record. The USGS deployed crews and scientists across the country to provide science and resources to emergency managers.
The 2021 Atlantic hurricane season was the third most-active season on record. The USGS deployed crews and scientists across the country to provide science and resources to emergency managers.

Missouri River Flooding - Landsat
Landsat images from March of 2018 and March of 2019 show a stretch of the Missouri, Platte, and Elkhorn rivers in a full scene that stretches from just north of Sioux City, IA, to south of Omaha, NE. The first image shows the rivers at normal levels.
Landsat images from March of 2018 and March of 2019 show a stretch of the Missouri, Platte, and Elkhorn rivers in a full scene that stretches from just north of Sioux City, IA, to south of Omaha, NE. The first image shows the rivers at normal levels.

Lake Powell
This year is the 150th Anniversary of John Wesley Powell’s expedition to explore the Colorado River, a 1,450-mile long waterway that runs through the Western United States and into Mexico.
This year is the 150th Anniversary of John Wesley Powell’s expedition to explore the Colorado River, a 1,450-mile long waterway that runs through the Western United States and into Mexico.

Hurricane Ida Water Footprint Data Visualization
Hurricane Ida made landfall as a Category 4 hurricane in Louisiana, and brought widespread precipitation and flooding along its path and up the northeastern coast of U.S. in the following week.
Hurricane Ida made landfall as a Category 4 hurricane in Louisiana, and brought widespread precipitation and flooding along its path and up the northeastern coast of U.S. in the following week.

USGS 21st Century Science - WILDLAND FIRE (portrait)
$71-$246 BILLION
Net annual economic impact of wildland fire across the U.S.1
650 MILLION
Acres of public lands that are managed for wildland fire.2
16.1 FATALITIES
Average annual fatalities from wildland fire.3
$71-$246 BILLION
Net annual economic impact of wildland fire across the U.S.1
650 MILLION
Acres of public lands that are managed for wildland fire.2
16.1 FATALITIES
Average annual fatalities from wildland fire.3

Examples of different type of high-water marks
Examples of different type of high-water marks (HWMs) that have the potential to be identified within high-resolution orthophotographs collected using unmanned aircraft systems (sUAS). Panel (A) shows a wash line formed when material is washed down the bank and/or laid over, panel (B) show a mud line depostied by the flood, panel (C) shows a debris line depost
Examples of different type of high-water marks (HWMs) that have the potential to be identified within high-resolution orthophotographs collected using unmanned aircraft systems (sUAS). Panel (A) shows a wash line formed when material is washed down the bank and/or laid over, panel (B) show a mud line depostied by the flood, panel (C) shows a debris line depost

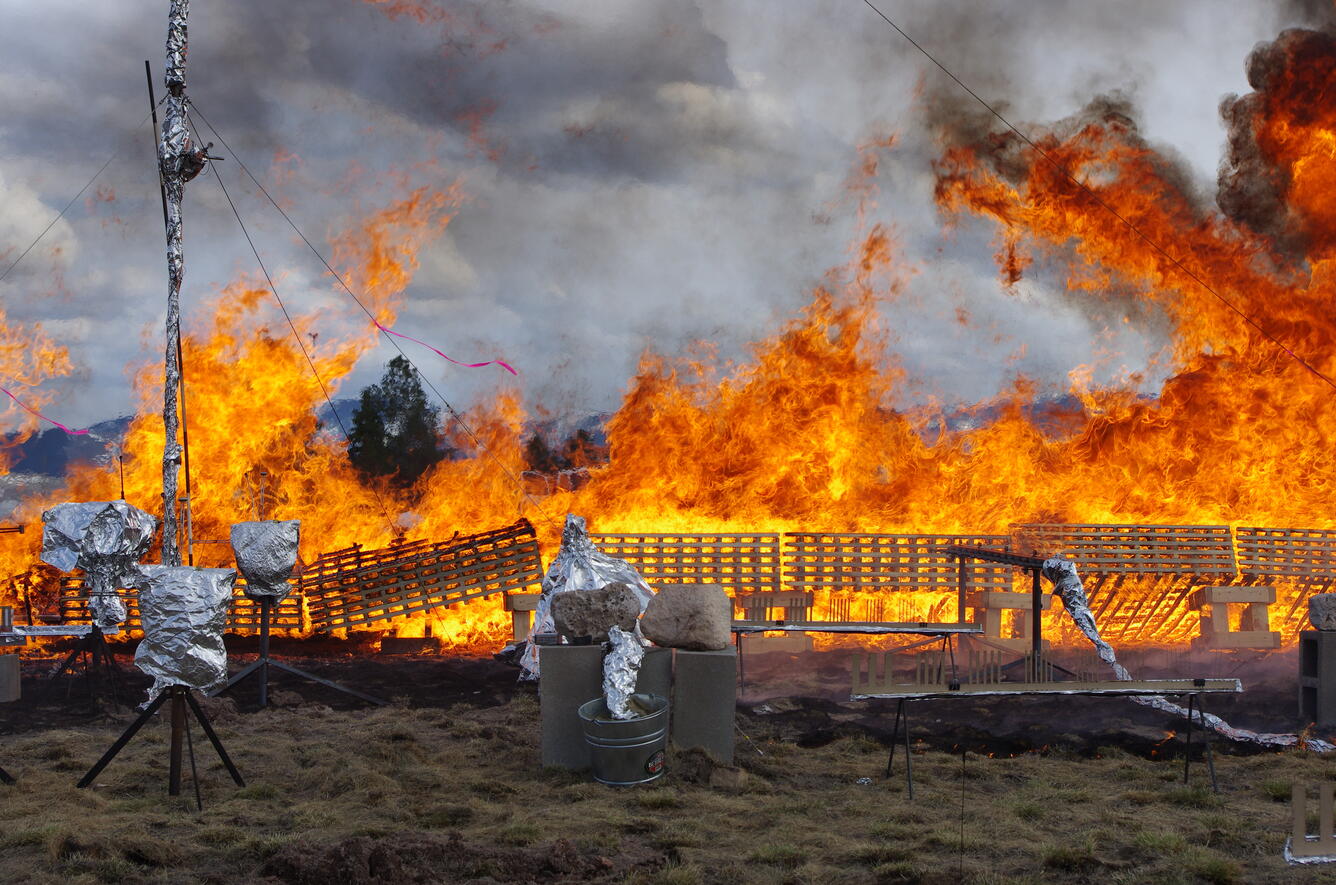
Thermal imaging for fire research
Use of thermal imaging helps researchers to understand the relationship of fuels and fire effects, Valles Caldera National Preserve, New Mexico, 2019.
Use of thermal imaging helps researchers to understand the relationship of fuels and fire effects, Valles Caldera National Preserve, New Mexico, 2019.
Filter Total Items: 14

Mohawk River Ice Jam Monitoring
The Mohawk River near Schenectady, NY is prone to ice jams during periods of river-ice break-up. Ice jams in this reach typically form at channel constrictions, bridge piers, lock and dam structures, and sections with a reduced floodplain (Foster and others, 2011). Ice jam related flooding can result from backwater associated with the jam or from water released downstream when a jam fails...

Ecological Drought
Droughts can be defined as meteorological, hydrological, agricultural, and/or ecological. Ecological drought is when below-normal water supplies create multiple stressors across ecosystems. USGS scientists are researching the ecological impacts of drought across the country.
By
Water is essential for all life on Earth, but too much water – or too little – can cause big problems. The USGS studies a wide range of water-related hazards, from large storms and flooding to drought and post-wildfire runoff, and helps communities plan for and respond to water-related emergencies.
National Water Dashboard
National Water Dashboard
When responding to a water event, it’s important to know where the water is. The USGS National Water Dashboard is a mobile, interactive tool that provides real-time information on water levels, weather, and flood forecasts.
From Snow to Flow: What Changing Snowmelt Means for Water in the Western U.S.
From Snow to Flow: What Changing Snowmelt Means for Water in the Western U.S.
A majority of the water in the western U.S. comes from snowmelt, but changes in the timing, magnitude, and duration of snowmelt can alter water availability downstream. See what changing snowmelt means for water in the West, and how new USGS efforts can advance snow science.
Examples of USGS Water and Extreme Weather Science
Examples of USGS Water and Extreme Weather Science
Water covers roughly 70 percent of the Earth’s surface and is the single most powerful driver for changing the landscape of the planet. Regardless of where in the water cycle the element sits, water and extreme weather can be disastrous. Intense storms can trigger landslides, flood low-lying areas, or create fast-moving rivers that can wipe out bridges and buildings. Extreme drought can lead to wildfires, poor water quality, and water scarcity. Climate change is affecting precipitation patterns and increasing weather extremes. By monitoring and studying water and extreme weather, we can improve our ability to protect lives, property, and natural resources when emergencies happen.
Innovative Solutions for Challenging Hazards
Water-related hazards can happen anywhere, but it’s impossible to collect on-the-ground data everywhere. Using new technologies like remote sensing, drones, artificial intelligence, and non-contact streamgages, we can keep the data flowing in previously unmonitored locations – and where it's too dangerous for people to go.
Hazards can often have complex and interrelated relationships – an earthquake can cause a tsunami, which in turn can cause inland flooding. An atmospheric river over a drought-stricken region can cause severe flooding, erosion, and mudslides. Because the USGS studies such a wide variety of hazards, our scientists can collaborate to study how multiple hazards interact, which can improve our ability to forecast and respond to multi-hazard events.
Sources/Usage: Public Domain. View Media Details
National Research Supports Local Response
As a federal science agency, the USGS is uniquely positioned to study water hazards that cross multiple states and regions. We can model water availability and stream statistics across the entire Nation. We can forecast coastal erosion along the entire East Coast. We can monitor flooding as hurricanes track from the Gulf Coast into inland states. We can transfer staff and equipment from one region to another when disaster strikes. We can use what we learn in one area of the country to help inform another. And all of our science and data is available to any local community or individual who needs it.
When it comes to water and extreme weather hazards, the USGS doesn't work alone – we support many federal, state, and local partners by providing real-time data and scientific expertise, deploying specialized instrumentation, and helping understand causes and effects once the event is over. Collaboration is crucial for responding to widespread threats like flooding, fires, and drought.
Science
Did we start the fire? Climate, Fire and Humans
The past decade encompasses some of the most extensive fire activity in recorded history. An area the size of Vermont (~24,000 km2) burned in a single Siberian fire in the summer of 2019 (Kehrwald et al., 2020 and references therein) while Australia, Indonesia and the Amazon have all experienced their most intense fires in recorded history (van Wees et al, 2021 and references therein). As more...
USGS Snow and Avalanche Project
Snow avalanches are a widespread natural hazard to humans and infrastructure as well as an important landscape disturbance affecting mountain ecosystems. Forecasting avalanche frequency is challenging on various spatial and temporal scales, and this project aims to fill a gap in snow science by focusing on reconstructing avalanche history on the continental mountain range scale - throughout the...
Tsunami and Earthquake Research
Here you will find general information on the science behind tsunami generation, computer animations of tsunamis, and summaries of past field studies.
Atmospheric Warming, Loss of Snow Cover, and Declining Colorado River Flow
Declining snow cover is playing a key role in decreasing the flow of the Colorado River, “the lifeblood of the Southwest,” by enabling increased evaporation. As the warming continues, increasingly severe water shortages are expected.
Using Drone Imagery to Assess Impacts of the 2018 Carr Fire
USGS WERC’s Dr. Karen Thorne and her research team are using drone imagery to understand how the 2018 Carr Fire affected ecosystems and cultural resources. The study, a collaboration with the National Park Service (NPS), focuses on Whiskeytown National Recreation Area in northern California. The drone images will help the WERC researchers identify changes in topography, cultural sites, debris...
Multimedia
Great Salt Lake comparison, 1986 and 2022
These Landsat images show the lake at record high levels in 1986 and at a historic low elevation on July 3, 2022.
These Landsat images show the lake at record high levels in 1986 and at a historic low elevation on July 3, 2022.
USGS streamgage 05430500 Rock River at Afton, WI webcam timelapse (January 2022)
Timelapse of webcam images taken at USGS streamgage 05430500 Rock River at Afton, WI during January 2022. Current webcam imagery for this site is available on the USGS HIVIS website.
Timelapse of webcam images taken at USGS streamgage 05430500 Rock River at Afton, WI during January 2022. Current webcam imagery for this site is available on the USGS HIVIS website.
USGS responds to busy 2021 Atlantic hurricane Season
The 2021 Atlantic hurricane season was the third most-active season on record. The USGS deployed crews and scientists across the country to provide science and resources to emergency managers.
The 2021 Atlantic hurricane season was the third most-active season on record. The USGS deployed crews and scientists across the country to provide science and resources to emergency managers.
Missouri River Flooding - Landsat
Landsat images from March of 2018 and March of 2019 show a stretch of the Missouri, Platte, and Elkhorn rivers in a full scene that stretches from just north of Sioux City, IA, to south of Omaha, NE. The first image shows the rivers at normal levels.
Landsat images from March of 2018 and March of 2019 show a stretch of the Missouri, Platte, and Elkhorn rivers in a full scene that stretches from just north of Sioux City, IA, to south of Omaha, NE. The first image shows the rivers at normal levels.
Lake Powell
This year is the 150th Anniversary of John Wesley Powell’s expedition to explore the Colorado River, a 1,450-mile long waterway that runs through the Western United States and into Mexico.
This year is the 150th Anniversary of John Wesley Powell’s expedition to explore the Colorado River, a 1,450-mile long waterway that runs through the Western United States and into Mexico.
Hurricane Ida Water Footprint Data Visualization
Hurricane Ida made landfall as a Category 4 hurricane in Louisiana, and brought widespread precipitation and flooding along its path and up the northeastern coast of U.S. in the following week.
Hurricane Ida made landfall as a Category 4 hurricane in Louisiana, and brought widespread precipitation and flooding along its path and up the northeastern coast of U.S. in the following week.
USGS 21st Century Science - WILDLAND FIRE (portrait)
$71-$246 BILLION
Net annual economic impact of wildland fire across the U.S.1
650 MILLION
Acres of public lands that are managed for wildland fire.2
16.1 FATALITIES
Average annual fatalities from wildland fire.3
$71-$246 BILLION
Net annual economic impact of wildland fire across the U.S.1
650 MILLION
Acres of public lands that are managed for wildland fire.2
16.1 FATALITIES
Average annual fatalities from wildland fire.3
Examples of different type of high-water marks
Examples of different type of high-water marks (HWMs) that have the potential to be identified within high-resolution orthophotographs collected using unmanned aircraft systems (sUAS). Panel (A) shows a wash line formed when material is washed down the bank and/or laid over, panel (B) show a mud line depostied by the flood, panel (C) shows a debris line depost
Examples of different type of high-water marks (HWMs) that have the potential to be identified within high-resolution orthophotographs collected using unmanned aircraft systems (sUAS). Panel (A) shows a wash line formed when material is washed down the bank and/or laid over, panel (B) show a mud line depostied by the flood, panel (C) shows a debris line depost
Thermal imaging for fire research
Use of thermal imaging helps researchers to understand the relationship of fuels and fire effects, Valles Caldera National Preserve, New Mexico, 2019.
Use of thermal imaging helps researchers to understand the relationship of fuels and fire effects, Valles Caldera National Preserve, New Mexico, 2019.
Filter Total Items: 14
Mohawk River Ice Jam Monitoring
The Mohawk River near Schenectady, NY is prone to ice jams during periods of river-ice break-up. Ice jams in this reach typically form at channel constrictions, bridge piers, lock and dam structures, and sections with a reduced floodplain (Foster and others, 2011). Ice jam related flooding can result from backwater associated with the jam or from water released downstream when a jam fails...
Ecological Drought
Droughts can be defined as meteorological, hydrological, agricultural, and/or ecological. Ecological drought is when below-normal water supplies create multiple stressors across ecosystems. USGS scientists are researching the ecological impacts of drought across the country.
By