

These Landsat images show the lake at record high levels in 1986 and at a historic low elevation on July 3, 2022.
Water and Extreme Weather
Water, Water, Everywhere!
Whether it's flooding from thunderstorms, storm surge, or tsunamis… sometimes water goes where we don’t want it.
Whether it's flooding from thunderstorms, storm surge, or tsunamis… sometimes water goes where we don’t want it.
Water, Water, Everywhere... or Not!
Great Salt Lake website tracks historically low lake levels and ecosystem effects of prolonged drought.
Great Salt Lake website tracks historically low lake levels and ecosystem effects of prolonged drought.
Before, During, and After the Flames
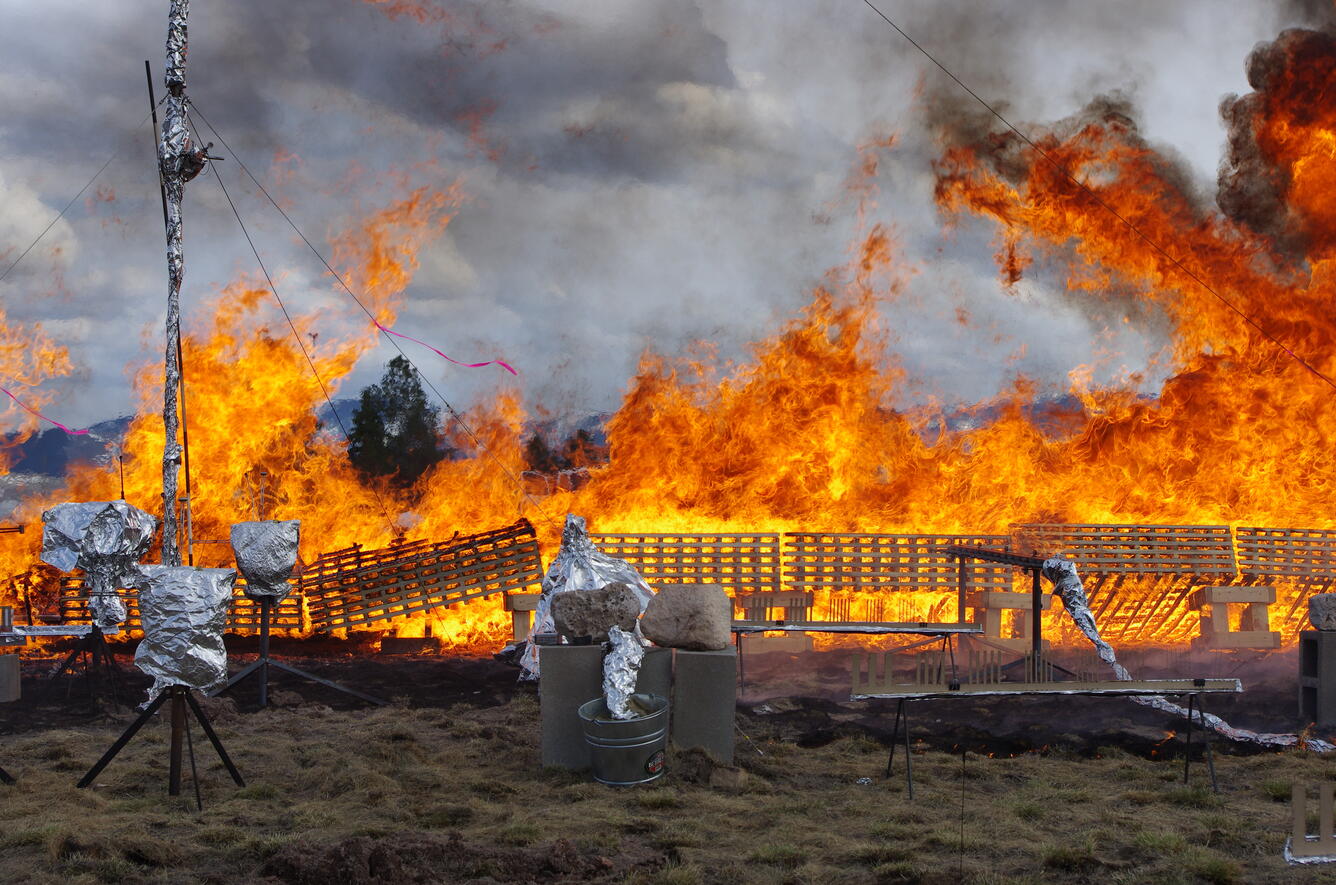
New Wildland Fire Science Strategy outlines research, technologies, and best practices to support risk, detection, and recovery.
New Wildland Fire Science Strategy outlines research, technologies, and best practices to support risk, detection, and recovery.
Could You Outrun a Tsunami Wave?
Interactive map shows areas where O‘ahu, Hawai’i, residents could evacuate on foot.
Interactive map shows areas where O‘ahu, Hawai’i, residents could evacuate on foot.
Keeping Communities Safe When Hurricanes Approach
USGS science provides response partners with crucial information about hurricane water levels, storm surge, coastal erosion, floodwater extent, and more.
USGS science provides response partners with crucial information about hurricane water levels, storm surge, coastal erosion, floodwater extent, and more.
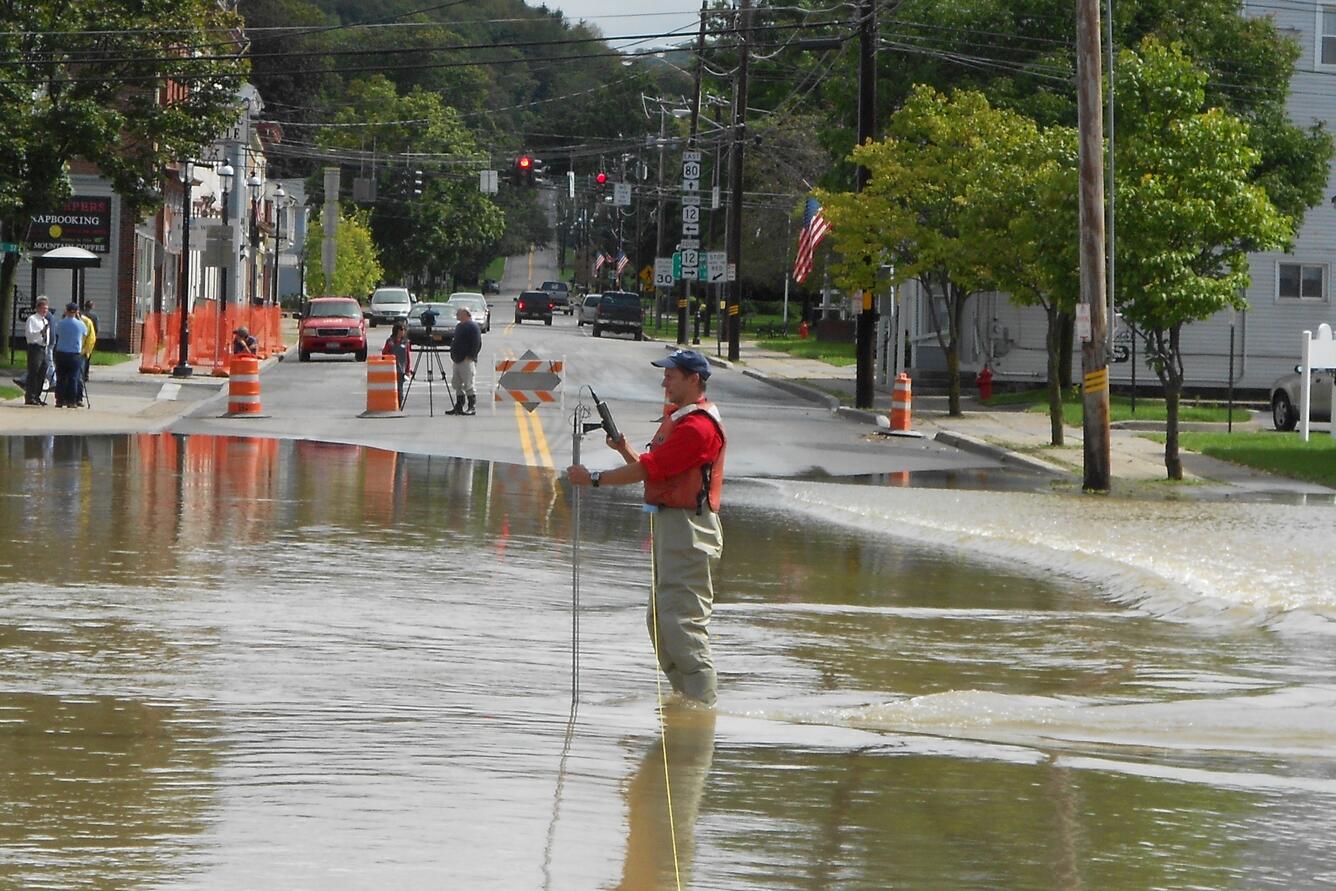
Water is essential for all life on Earth, but too much water – or too little – can cause big problems. The USGS studies a wide range of water-related hazards, from large storms and flooding to drought and post-wildfire runoff, and helps communities plan for and respond to water-related emergencies.
National Water Dashboard
National Water Dashboard

When responding to a water event, it’s important to know where the water is. The USGS National Water Dashboard is a mobile, interactive tool that provides real-time information on water levels, weather, and flood forecasts.
From Snow to Flow: What Changing Snowmelt Means for Water in the Western U.S.
From Snow to Flow: What Changing Snowmelt Means for Water in the Western U.S.

A majority of the water in the western U.S. comes from snowmelt, but changes in the timing, magnitude, and duration of snowmelt can alter water availability downstream. See what changing snowmelt means for water in the West, and how new USGS efforts can advance snow science.
Examples of USGS Water and Extreme Weather Science
Examples of USGS Water and Extreme Weather Science
Water covers roughly 70 percent of the Earth’s surface and is the single most powerful driver for changing the landscape of the planet. Regardless of where in the water cycle the element sits, water and extreme weather can be disastrous. Intense storms can trigger landslides, flood low-lying areas, or create fast-moving rivers that can wipe out bridges and buildings. Extreme drought can lead to wildfires, poor water quality, and water scarcity. Climate change is affecting precipitation patterns and increasing weather extremes. By monitoring and studying water and extreme weather, we can improve our ability to protect lives, property, and natural resources when emergencies happen.
Innovative Solutions for Challenging Hazards
Water-related hazards can happen anywhere, but it’s impossible to collect on-the-ground data everywhere. Using new technologies like remote sensing, drones, artificial intelligence, and non-contact streamgages, we can keep the data flowing in previously unmonitored locations – and where it's too dangerous for people to go.
Hazards can often have complex and interrelated relationships – an earthquake can cause a tsunami, which in turn can cause inland flooding. An atmospheric river over a drought-stricken region can cause severe flooding, erosion, and mudslides. Because the USGS studies such a wide variety of hazards, our scientists can collaborate to study how multiple hazards interact, which can improve our ability to forecast and respond to multi-hazard events.


Sources/Usage: Public Domain. View Media Details
National Research Supports Local Response
As a federal science agency, the USGS is uniquely positioned to study water hazards that cross multiple states and regions. We can model water availability and stream statistics across the entire Nation. We can forecast coastal erosion along the entire East Coast. We can monitor flooding as hurricanes track from the Gulf Coast into inland states. We can transfer staff and equipment from one region to another when disaster strikes. We can use what we learn in one area of the country to help inform another. And all of our science and data is available to any local community or individual who needs it.
When it comes to water and extreme weather hazards, the USGS doesn't work alone – we support many federal, state, and local partners by providing real-time data and scientific expertise, deploying specialized instrumentation, and helping understand causes and effects once the event is over. Collaboration is crucial for responding to widespread threats like flooding, fires, and drought.
Science
Flood Inundation Mapping (FIM) Program
The USGS Flood Inundation Mapping (FIM) Program helps communities protect lives and property by providing tools and information to help them understand their local flood risks and make cost-effective mitigation decisions.

Did we start the fire? Drought, Fire and Humans
The past decade encompasses some of the most extensive fire activity in recorded history. An area the size of Vermont (~24,000 km2) burned in a single Siberian fire in the summer of 2019 (Kehrwald et al., 2020 and references therein) while Australia, Indonesia and the Amazon have all experienced their most intense fires in recorded history (van Wees et al, 2021 and references therein). As more...

USGS Snow and Avalanche Project
Snow avalanches are a widespread natural hazard to humans and infrastructure as well as an important landscape disturbance affecting mountain ecosystems. Forecasting avalanche frequency is challenging on various spatial and temporal scales, and this project aims to fill a gap in snow science by focusing on reconstructing avalanche history on the continental mountain range scale - throughout the...

Tsunami and Earthquake Research
Here you will find general information on the science behind tsunami generation, computer animations of tsunamis, and summaries of past field studies.

Atmospheric Warming, Loss of Snow Cover, and Declining Colorado River Flow
Declining snow cover is playing a key role in decreasing the flow of the Colorado River, “the lifeblood of the Southwest,” by enabling increased evaporation. As the warming continues, increasingly severe water shortages are expected.
Multimedia
These Landsat images show the lake at record high levels in 1986 and at a historic low elevation on July 3, 2022.

USGS streamgage 05430500 Rock River at Afton, WI webcam timelapse (January 2022)
USGS streamgage 05430500 Rock River at Afton, WI webcam timelapse (January 2022)Timelapse of webcam images taken at USGS streamgage 05430500 Rock River at Afton, WI during January 2022. Current webcam imagery for this site is available on the USGS HIVIS website.

USGS responds to busy 2021 Atlantic hurricane Season
USGS responds to busy 2021 Atlantic hurricane SeasonThe 2021 Atlantic hurricane season was the third most-active season on record. The USGS deployed crews and scientists across the country to provide science and resources to emergency managers.
USGS responds to busy 2021 Atlantic hurricane Season
USGS responds to busy 2021 Atlantic hurricane SeasonThe 2021 Atlantic hurricane season was the third most-active season on record. The USGS deployed crews and scientists across the country to provide science and resources to emergency managers.

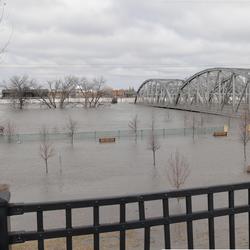
Missouri River Flooding - Landsat
Landsat images from March of 2018 and March of 2019 show a stretch of the Missouri, Platte, and Elkhorn rivers in a full scene that stretches from just north of Sioux City, IA, to south of Omaha, NE. The first image shows the rivers at normal levels.
Landsat images from March of 2018 and March of 2019 show a stretch of the Missouri, Platte, and Elkhorn rivers in a full scene that stretches from just north of Sioux City, IA, to south of Omaha, NE. The first image shows the rivers at normal levels.

Lake Powell
This year is the 150th Anniversary of John Wesley Powell’s expedition to explore the Colorado River, a 1,450-mile long waterway that runs through the Western United States and into Mexico.
This year is the 150th Anniversary of John Wesley Powell’s expedition to explore the Colorado River, a 1,450-mile long waterway that runs through the Western United States and into Mexico.

Hurricane Ida Water Footprint Data Visualization
Hurricane Ida made landfall as a Category 4 hurricane in Louisiana, and brought widespread precipitation and flooding along its path and up the northeastern coast of U.S. in the following week.
Hurricane Ida made landfall as a Category 4 hurricane in Louisiana, and brought widespread precipitation and flooding along its path and up the northeastern coast of U.S. in the following week.

USGS 21st Century Science - WILDLAND FIRE (portrait)
USGS 21st Century Science - WILDLAND FIRE (portrait)\$71-\$246 BILLION
Net annual economic impact of wildland fire across the U.S.1
650 MILLION
Acres of public lands that are managed for wildland fire.2
16.1 FATALITIES
Average annual fatalities from wildland fire.3

Examples of different type of high-water marks
Examples of different type of high-water marks (HWMs) that have the potential to be identified within high-resolution orthophotographs collected using unmanned aircraft systems (sUAS). Panel (A) shows a wash line formed when material is washed down the bank and/or laid over, panel (B) show a mud line depostied by the flood, panel (C) shows a debris line depost
Examples of different type of high-water marks (HWMs) that have the potential to be identified within high-resolution orthophotographs collected using unmanned aircraft systems (sUAS). Panel (A) shows a wash line formed when material is washed down the bank and/or laid over, panel (B) show a mud line depostied by the flood, panel (C) shows a debris line depost

Thermal imaging for fire research
Use of thermal imaging helps researchers to understand the relationship of fuels and fire effects, Valles Caldera National Preserve, New Mexico, 2019.
Use of thermal imaging helps researchers to understand the relationship of fuels and fire effects, Valles Caldera National Preserve, New Mexico, 2019.
Filter Total Items: 14
Flood Inundation Mapping (FIM) Program
The USGS Flood Inundation Mapping (FIM) Program helps communities protect lives and property by providing tools and information to help them understand their local flood risks and make cost-effective mitigation decisions.
Did we start the fire? Drought, Fire and Humans
The past decade encompasses some of the most extensive fire activity in recorded history. An area the size of Vermont (~24,000 km2) burned in a single Siberian fire in the summer of 2019 (Kehrwald et al., 2020 and references therein) while Australia, Indonesia and the Amazon have all experienced their most intense fires in recorded history (van Wees et al, 2021 and references therein). As more...
USGS Snow and Avalanche Project
Snow avalanches are a widespread natural hazard to humans and infrastructure as well as an important landscape disturbance affecting mountain ecosystems. Forecasting avalanche frequency is challenging on various spatial and temporal scales, and this project aims to fill a gap in snow science by focusing on reconstructing avalanche history on the continental mountain range scale - throughout the...
Tsunami and Earthquake Research
Here you will find general information on the science behind tsunami generation, computer animations of tsunamis, and summaries of past field studies.
Atmospheric Warming, Loss of Snow Cover, and Declining Colorado River Flow
Declining snow cover is playing a key role in decreasing the flow of the Colorado River, “the lifeblood of the Southwest,” by enabling increased evaporation. As the warming continues, increasingly severe water shortages are expected.

Using Drone Imagery to Assess Impacts of the 2018 Carr Fire
USGS WERC’s Dr. Karen Thorne and her research team are using drone imagery to understand how the 2018 Carr Fire affected ecosystems and cultural resources. The study, a collaboration with the National Park Service (NPS), focuses on Whiskeytown National Recreation Area in northern California. The drone images will help the WERC researchers identify changes in topography, cultural sites, debris...

USGS Flood Information
The USGS collects flood data and conducts targeted flood science to help Federal, State, and local agencies, decision makers, and the public before, during, and after a flood. Our efforts provide situational awareness, drive predictive models, inform infrastructure design and operation, undergird floodplain mapping, assist flood constituent/load quantification, and facilitate flood impact...

Storm-Tide Monitoring
It is important to understand how hurricanes and major storms affect coastal areas that are also subject to tidal flows. The only way to do this is to deploy many monitoring sites in the path of these storms, and collect data before, during, and after the storm passes. USGS often deploys this storm-tide monitoring equipment.

Tsunamis and Tsunami Hazards
You don't hear about tsunamis very often, but when they do strike, they can be huge newsmakers and can have drastic and devastating effects. The occurrence and potential for tsunamis on the coasts of the United States is not out of the question. Read on to learn about tsunamis.

The 100-Year Flood
A 100-year flood happened last year so it won't happen for another 99 years, right? Not exactly. Misinterpretation of terminology often leads to confusion about flood recurrence intervals. Read on to learn more.

Post-Fire Flooding and Debris Flow
Fast-moving, highly destructive debris flows triggered by intense rainfall are one of the most dangerous post-fire hazards. The risk of floods and debris flows after fires increases due to vegetation loss and soil exposure. Cases of sudden and deadly debris flow are well documented along the western United States, particularly in Southern California. These flows are a risk to life and property...

National Assessment of Coastal Change Hazards
Research to identify areas that are most vulnerable to coastal change hazards including beach and dune erosion, long-term shoreline change, and sea-level rise.
By
Natural Hazards Mission Area, Coastal and Marine Hazards and Resources Program, Pacific Coastal and Marine Science Center, St. Petersburg Coastal and Marine Science Center, Woods Hole Coastal and Marine Science Center, Gulf of America, Hurricane Harvey, Hurricane Irma, Hurricane Jose, Hurricane Maria, Hurricane Matthew, Hurricane Sandy
Great Salt Lake comparison, 1986 and 2022
These Landsat images show the lake at record high levels in 1986 and at a historic low elevation on July 3, 2022.
These Landsat images show the lake at record high levels in 1986 and at a historic low elevation on July 3, 2022.
USGS streamgage 05430500 Rock River at Afton, WI webcam timelapse (January 2022)
USGS streamgage 05430500 Rock River at Afton, WI webcam timelapse (January 2022)Timelapse of webcam images taken at USGS streamgage 05430500 Rock River at Afton, WI during January 2022. Current webcam imagery for this site is available on the USGS HIVIS website.
USGS responds to busy 2021 Atlantic hurricane Season
USGS responds to busy 2021 Atlantic hurricane SeasonThe 2021 Atlantic hurricane season was the third most-active season on record. The USGS deployed crews and scientists across the country to provide science and resources to emergency managers.
USGS responds to busy 2021 Atlantic hurricane Season
USGS responds to busy 2021 Atlantic hurricane SeasonThe 2021 Atlantic hurricane season was the third most-active season on record. The USGS deployed crews and scientists across the country to provide science and resources to emergency managers.
Lake Powell
This year is the 150th Anniversary of John Wesley Powell’s expedition to explore the Colorado River, a 1,450-mile long waterway that runs through the Western United States and into Mexico.
This year is the 150th Anniversary of John Wesley Powell’s expedition to explore the Colorado River, a 1,450-mile long waterway that runs through the Western United States and into Mexico.
Missouri River Flooding - Landsat
Landsat images from March of 2018 and March of 2019 show a stretch of the Missouri, Platte, and Elkhorn rivers in a full scene that stretches from just north of Sioux City, IA, to south of Omaha, NE. The first image shows the rivers at normal levels.
Landsat images from March of 2018 and March of 2019 show a stretch of the Missouri, Platte, and Elkhorn rivers in a full scene that stretches from just north of Sioux City, IA, to south of Omaha, NE. The first image shows the rivers at normal levels.
Hurricane Ida Water Footprint Data Visualization
Hurricane Ida made landfall as a Category 4 hurricane in Louisiana, and brought widespread precipitation and flooding along its path and up the northeastern coast of U.S. in the following week.
Hurricane Ida made landfall as a Category 4 hurricane in Louisiana, and brought widespread precipitation and flooding along its path and up the northeastern coast of U.S. in the following week.
USGS 21st Century Science - WILDLAND FIRE (portrait)
USGS 21st Century Science - WILDLAND FIRE (portrait)\$71-\$246 BILLION
Net annual economic impact of wildland fire across the U.S.1
650 MILLION
Acres of public lands that are managed for wildland fire.2
16.1 FATALITIES
Average annual fatalities from wildland fire.3
Examples of different type of high-water marks
Examples of different type of high-water marks (HWMs) that have the potential to be identified within high-resolution orthophotographs collected using unmanned aircraft systems (sUAS). Panel (A) shows a wash line formed when material is washed down the bank and/or laid over, panel (B) show a mud line depostied by the flood, panel (C) shows a debris line depost
Examples of different type of high-water marks (HWMs) that have the potential to be identified within high-resolution orthophotographs collected using unmanned aircraft systems (sUAS). Panel (A) shows a wash line formed when material is washed down the bank and/or laid over, panel (B) show a mud line depostied by the flood, panel (C) shows a debris line depost
Thermal imaging for fire research
Use of thermal imaging helps researchers to understand the relationship of fuels and fire effects, Valles Caldera National Preserve, New Mexico, 2019.
Use of thermal imaging helps researchers to understand the relationship of fuels and fire effects, Valles Caldera National Preserve, New Mexico, 2019.

USGS Storm Tide Sensors: Measuring Coastal Storm Tide and Flooding
USGS Storm Tide Sensors: Measuring Coastal Storm Tide and FloodingUSGS Storm Tide Sensors are specialized scientific instruments used to measure the depth and duration of storm surge during coastal storms. The data these sensors collect before, during and after a storm will help public officials assess storm damage, and improve computer models used to forecast storm surge and coastal change.

Partners discuss seasonal drought experiments.
Partners discuss seasonal drought experiments.
Partners discuss seasonal drought experiments.

USGS Hurricane Preparedness
Before a hurricane, USGS Scientists undertake a data collection effort of a grand scale. They install a temporary mobile network of sensors along the coasts to collect additional data on the intensity of storm surge, one of the most dangerous elements of a hurricane.
Before a hurricane, USGS Scientists undertake a data collection effort of a grand scale. They install a temporary mobile network of sensors along the coasts to collect additional data on the intensity of storm surge, one of the most dangerous elements of a hurricane.

Taking a High-Water Mark after Hurricane Harvey
USGS scientist Steve Hannes marks high water marks along the Colorado River after flooding from Harvey in Matagorda County, Texas.
USGS scientist Steve Hannes marks high water marks along the Colorado River after flooding from Harvey in Matagorda County, Texas.

USGS Employee Performing Measurement In Record Flood At Gage 7018500
USGS Employee Performing Measurement In Record Flood At Gage 7018500USGS employee Aaron Walsh performing wire weight measurement in record flood at gage 7018500 Big River at Byrnesville, MO
USGS Employee Performing Measurement In Record Flood At Gage 7018500
USGS Employee Performing Measurement In Record Flood At Gage 7018500USGS employee Aaron Walsh performing wire weight measurement in record flood at gage 7018500 Big River at Byrnesville, MO

Las Lomas Debris Flow, January 2017
The June 2016 Fish Fire burned over 12 km^2 in Los Angeles County, California. After the fire, the USGS installed an automated rain-triggered camera to monitor post-wildfire flooding and debris flow in a small canyon above the Las Lomas debris basin in Duarte. This GIF shows part of the peak flow triggered by an intense rainstorm on January 20, 2017.
The June 2016 Fish Fire burned over 12 km^2 in Los Angeles County, California. After the fire, the USGS installed an automated rain-triggered camera to monitor post-wildfire flooding and debris flow in a small canyon above the Las Lomas debris basin in Duarte. This GIF shows part of the peak flow triggered by an intense rainstorm on January 20, 2017.

Storm surge sensor installation prior to Hurricane Irene landfall
Storm surge sensor installation prior to Hurricane Irene landfallStorm surge sensor installation prior to Hurricane Irene landfall
Storm surge sensor installation prior to Hurricane Irene landfall
Storm surge sensor installation prior to Hurricane Irene landfallStorm surge sensor installation prior to Hurricane Irene landfall

Monsoon-Rain Flow in an Ephemeral Channel near Sierra Vista, Arizona
Monsoon-Rain Flow in an Ephemeral Channel near Sierra Vista, ArizonaAs part of the assessment of the binational San Pedro aquifer, the effects of urbanization on runoff in ephemeral streams was studied. Ephemeral streams are those that flow in response to precipitation. Runoff in tributaries to the San Pedro River is important in understanding the water budget of the river.
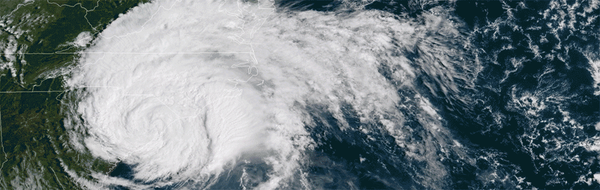
Satellite image of Hurricane Florence after making landfall in NC
Satellite image of Hurricane Florence after making landfall in NCSatellite image of Hurricane Florence after making landfall in North Carolina. NOAA image.
Satellite image of Hurricane Florence after making landfall in NC
Satellite image of Hurricane Florence after making landfall in NCSatellite image of Hurricane Florence after making landfall in North Carolina. NOAA image.

What are tsunamis? What are tsunamis?
Tsunamis are ocean waves triggered by: Large earthquakes that occur near or under the ocean Volcanic eruptions Submarine landslides Onshore landslides in which large volumes of debris fall into the water Scientists do not use the term "tidal wave" because these waves are not caused by tides. Tsunami waves are unlike typical ocean waves generated by wind and storms, and most tsunamis do not "break"...

When does a drought begin and end? When does a drought begin and end?
The beginning of a drought is difficult to determine. Several weeks, months, or even years might pass before people know that a drought is occurring. The end of a drought can occur as gradually as it began. The first evidence of drought is usually seen in records of rainfall. Within a short period of time, the amount of moisture in soils can begin to decrease. The effects of a drought on flow in...

How are floods predicted? How are floods predicted?
Flood predictions require several types of data: The amount of rainfall occurring on a real-time basis. The rate of change in river stage on a real-time basis, which can help indicate the severity and immediacy of the threat. Knowledge about the type of storm producing the moisture, such as duration, intensity and areal extent, which can be valuable for determining possible severity of the...

Why doesn't a drought end when it rains? Why doesn't a drought end when it rains?
Rainfall in any form will provide some drought relief. A good analogy might be how medicine and illness relate to each other. A single dose of medicine can alleviate symptoms of illness, but it usually takes a sustained program of medication to cure an illness. Likewise, a single rainstorm will not break the drought, but it might provide temporary relief. A light to moderate shower will probably...

What is the role of the USGS in responding to hurricanes? What is the role of the USGS in responding to hurricanes?
The USGS creates detailed maps of our Nation’s shorelines, dunes, and coastal cliffs, and studies how storm processes impact our coastlines. This information is used to predict and map coastal vulnerability to changes caused by major storms, long-term shoreline erosion, sea-level rise, and sea cliff erosion. One example is the USGS Total Water Level and Coastal Change Forecast Viewer, which uses...

How can a 1,000-year rainfall not result in a 1,000-year flood? How can a 1,000-year rainfall not result in a 1,000-year flood?
It comes down to a number of factors, including the pattern of movement of the rainstorm in each particular watershed, the conditions of the soil and plant matter in the watershed, and the timing of the rainstorm in one watershed versus other watersheds. For example, if the ground is already saturated before a rainstorm, much of the rain will run off into streams, but if the ground is dry, it will...
We had a "100-year flood" two years in a row. How can that be? We had a "100-year flood" two years in a row. How can that be?
The term "100-year flood" is used to describe the recurrence interval of floods. The 100-year recurrence interval means that a flood of that magnitude has a one percent chance of occurring in any given year. In other words, the chances that a river will flow as high as the 100-year flood stage this year is 1 in 100. Statistically, each year begins with the same 1-percent chance that a 100-year...

What are the two types of floods? What are the two types of floods?
There are two basic types of floods: flash floods and the more widespread river floods. Flash floods generally cause greater loss of life and river floods generally cause greater loss of property. A flash flood occurs when runoff from excessive rainfall causes a rapid rise in the water height (stage) of a stream or normally-dry channel. Flash floods are more common in areas with a dry climate and...

Can a drought be relieved by bringing in water from other regions of the country that have excess water? Can a drought be relieved by bringing in water from other regions of the country that have excess water?
Any large-scale projects for mitigating drought in the U.S. would fall under the direction of the Bureau of Reclamation, which is the federal agency tasked with water management. While technically feasible, transporting surface water from flood areas (or the ocean) to drought areas faces many challenges including water rights, property rights, environmental impacts, and more. Then there's the...

What should I know about wildfires and debris flows? What should I know about wildfires and debris flows?
Wildland fires are inevitable in the western United States. Expansion of human development into forested areas has created a situation where wildfires can adversely affect lives and property, as can the flooding and landslides that occur in the aftermath of the fires. There is a need to develop tools and methods to identify and quantify the potential hazards posed by landslides produced from...

Could a large tsunami happen in the United States? Could a large tsunami happen in the United States?
Large tsunamis have occurred in the United States and will undoubtedly occur again. Significant earthquakes around the Pacific rim have generated tsunamis that struck Hawaii, Alaska, and the U.S. west coast. One of the largest and most devastating tsunamis that Hawaii has experienced was in 1946 from an earthquake along the Aleutian subduction zone. Runup heights reached a maximum of 33 to 55 feet...

What is a landslide and what causes one? What is a landslide and what causes one?
A landslide is defined as the movement of a mass of rock, debris, or earth down a slope. Landslides are a type of "mass wasting," which denotes any down-slope movement of soil and rock under the direct influence of gravity. The term "landslide" encompasses five modes of slope movement: falls, topples, slides, spreads, and flows. These are further subdivided by the type of geologic material...
Water is essential for all life on Earth, but too much water – or too little – can cause big problems. The USGS studies a wide range of water-related hazards, from large storms and flooding to drought and post-wildfire runoff, and helps communities plan for and respond to water-related emergencies.
National Water Dashboard
National Water Dashboard
When responding to a water event, it’s important to know where the water is. The USGS National Water Dashboard is a mobile, interactive tool that provides real-time information on water levels, weather, and flood forecasts.
From Snow to Flow: What Changing Snowmelt Means for Water in the Western U.S.
From Snow to Flow: What Changing Snowmelt Means for Water in the Western U.S.
A majority of the water in the western U.S. comes from snowmelt, but changes in the timing, magnitude, and duration of snowmelt can alter water availability downstream. See what changing snowmelt means for water in the West, and how new USGS efforts can advance snow science.
Examples of USGS Water and Extreme Weather Science
Examples of USGS Water and Extreme Weather Science
Water covers roughly 70 percent of the Earth’s surface and is the single most powerful driver for changing the landscape of the planet. Regardless of where in the water cycle the element sits, water and extreme weather can be disastrous. Intense storms can trigger landslides, flood low-lying areas, or create fast-moving rivers that can wipe out bridges and buildings. Extreme drought can lead to wildfires, poor water quality, and water scarcity. Climate change is affecting precipitation patterns and increasing weather extremes. By monitoring and studying water and extreme weather, we can improve our ability to protect lives, property, and natural resources when emergencies happen.
Innovative Solutions for Challenging Hazards
Water-related hazards can happen anywhere, but it’s impossible to collect on-the-ground data everywhere. Using new technologies like remote sensing, drones, artificial intelligence, and non-contact streamgages, we can keep the data flowing in previously unmonitored locations – and where it's too dangerous for people to go.
Hazards can often have complex and interrelated relationships – an earthquake can cause a tsunami, which in turn can cause inland flooding. An atmospheric river over a drought-stricken region can cause severe flooding, erosion, and mudslides. Because the USGS studies such a wide variety of hazards, our scientists can collaborate to study how multiple hazards interact, which can improve our ability to forecast and respond to multi-hazard events.
Sources/Usage: Public Domain. View Media Details
National Research Supports Local Response
As a federal science agency, the USGS is uniquely positioned to study water hazards that cross multiple states and regions. We can model water availability and stream statistics across the entire Nation. We can forecast coastal erosion along the entire East Coast. We can monitor flooding as hurricanes track from the Gulf Coast into inland states. We can transfer staff and equipment from one region to another when disaster strikes. We can use what we learn in one area of the country to help inform another. And all of our science and data is available to any local community or individual who needs it.
When it comes to water and extreme weather hazards, the USGS doesn't work alone – we support many federal, state, and local partners by providing real-time data and scientific expertise, deploying specialized instrumentation, and helping understand causes and effects once the event is over. Collaboration is crucial for responding to widespread threats like flooding, fires, and drought.
Science
Flood Inundation Mapping (FIM) Program
The USGS Flood Inundation Mapping (FIM) Program helps communities protect lives and property by providing tools and information to help them understand their local flood risks and make cost-effective mitigation decisions.
Did we start the fire? Drought, Fire and Humans
The past decade encompasses some of the most extensive fire activity in recorded history. An area the size of Vermont (~24,000 km2) burned in a single Siberian fire in the summer of 2019 (Kehrwald et al., 2020 and references therein) while Australia, Indonesia and the Amazon have all experienced their most intense fires in recorded history (van Wees et al, 2021 and references therein). As more...
USGS Snow and Avalanche Project
Snow avalanches are a widespread natural hazard to humans and infrastructure as well as an important landscape disturbance affecting mountain ecosystems. Forecasting avalanche frequency is challenging on various spatial and temporal scales, and this project aims to fill a gap in snow science by focusing on reconstructing avalanche history on the continental mountain range scale - throughout the...
Tsunami and Earthquake Research
Here you will find general information on the science behind tsunami generation, computer animations of tsunamis, and summaries of past field studies.
Atmospheric Warming, Loss of Snow Cover, and Declining Colorado River Flow
Declining snow cover is playing a key role in decreasing the flow of the Colorado River, “the lifeblood of the Southwest,” by enabling increased evaporation. As the warming continues, increasingly severe water shortages are expected.
Multimedia
Great Salt Lake comparison, 1986 and 2022
These Landsat images show the lake at record high levels in 1986 and at a historic low elevation on July 3, 2022.
These Landsat images show the lake at record high levels in 1986 and at a historic low elevation on July 3, 2022.
USGS streamgage 05430500 Rock River at Afton, WI webcam timelapse (January 2022)
USGS streamgage 05430500 Rock River at Afton, WI webcam timelapse (January 2022)Timelapse of webcam images taken at USGS streamgage 05430500 Rock River at Afton, WI during January 2022. Current webcam imagery for this site is available on the USGS HIVIS website.
USGS streamgage 05430500 Rock River at Afton, WI webcam timelapse (January 2022)
USGS streamgage 05430500 Rock River at Afton, WI webcam timelapse (January 2022)Timelapse of webcam images taken at USGS streamgage 05430500 Rock River at Afton, WI during January 2022. Current webcam imagery for this site is available on the USGS HIVIS website.
USGS responds to busy 2021 Atlantic hurricane Season
USGS responds to busy 2021 Atlantic hurricane SeasonThe 2021 Atlantic hurricane season was the third most-active season on record. The USGS deployed crews and scientists across the country to provide science and resources to emergency managers.
USGS responds to busy 2021 Atlantic hurricane Season
USGS responds to busy 2021 Atlantic hurricane SeasonThe 2021 Atlantic hurricane season was the third most-active season on record. The USGS deployed crews and scientists across the country to provide science and resources to emergency managers.
Missouri River Flooding - Landsat
Landsat images from March of 2018 and March of 2019 show a stretch of the Missouri, Platte, and Elkhorn rivers in a full scene that stretches from just north of Sioux City, IA, to south of Omaha, NE. The first image shows the rivers at normal levels.
Landsat images from March of 2018 and March of 2019 show a stretch of the Missouri, Platte, and Elkhorn rivers in a full scene that stretches from just north of Sioux City, IA, to south of Omaha, NE. The first image shows the rivers at normal levels.
Lake Powell
This year is the 150th Anniversary of John Wesley Powell’s expedition to explore the Colorado River, a 1,450-mile long waterway that runs through the Western United States and into Mexico.
This year is the 150th Anniversary of John Wesley Powell’s expedition to explore the Colorado River, a 1,450-mile long waterway that runs through the Western United States and into Mexico.
Hurricane Ida Water Footprint Data Visualization
Hurricane Ida made landfall as a Category 4 hurricane in Louisiana, and brought widespread precipitation and flooding along its path and up the northeastern coast of U.S. in the following week.
Hurricane Ida made landfall as a Category 4 hurricane in Louisiana, and brought widespread precipitation and flooding along its path and up the northeastern coast of U.S. in the following week.
USGS 21st Century Science - WILDLAND FIRE (portrait)
USGS 21st Century Science - WILDLAND FIRE (portrait)\$71-\$246 BILLION
Net annual economic impact of wildland fire across the U.S.1
650 MILLION
Acres of public lands that are managed for wildland fire.2
16.1 FATALITIES
Average annual fatalities from wildland fire.3
USGS 21st Century Science - WILDLAND FIRE (portrait)
USGS 21st Century Science - WILDLAND FIRE (portrait)\$71-\$246 BILLION
Net annual economic impact of wildland fire across the U.S.1
650 MILLION
Acres of public lands that are managed for wildland fire.2
16.1 FATALITIES
Average annual fatalities from wildland fire.3
Examples of different type of high-water marks
Examples of different type of high-water marks (HWMs) that have the potential to be identified within high-resolution orthophotographs collected using unmanned aircraft systems (sUAS). Panel (A) shows a wash line formed when material is washed down the bank and/or laid over, panel (B) show a mud line depostied by the flood, panel (C) shows a debris line depost
Examples of different type of high-water marks (HWMs) that have the potential to be identified within high-resolution orthophotographs collected using unmanned aircraft systems (sUAS). Panel (A) shows a wash line formed when material is washed down the bank and/or laid over, panel (B) show a mud line depostied by the flood, panel (C) shows a debris line depost
Thermal imaging for fire research
Use of thermal imaging helps researchers to understand the relationship of fuels and fire effects, Valles Caldera National Preserve, New Mexico, 2019.
Use of thermal imaging helps researchers to understand the relationship of fuels and fire effects, Valles Caldera National Preserve, New Mexico, 2019.
Filter Total Items: 14
Flood Inundation Mapping (FIM) Program
The USGS Flood Inundation Mapping (FIM) Program helps communities protect lives and property by providing tools and information to help them understand their local flood risks and make cost-effective mitigation decisions.
Did we start the fire? Drought, Fire and Humans
The past decade encompasses some of the most extensive fire activity in recorded history. An area the size of Vermont (~24,000 km2) burned in a single Siberian fire in the summer of 2019 (Kehrwald et al., 2020 and references therein) while Australia, Indonesia and the Amazon have all experienced their most intense fires in recorded history (van Wees et al, 2021 and references therein). As more...
USGS Snow and Avalanche Project
Snow avalanches are a widespread natural hazard to humans and infrastructure as well as an important landscape disturbance affecting mountain ecosystems. Forecasting avalanche frequency is challenging on various spatial and temporal scales, and this project aims to fill a gap in snow science by focusing on reconstructing avalanche history on the continental mountain range scale - throughout the...
Tsunami and Earthquake Research
Here you will find general information on the science behind tsunami generation, computer animations of tsunamis, and summaries of past field studies.
Atmospheric Warming, Loss of Snow Cover, and Declining Colorado River Flow
Declining snow cover is playing a key role in decreasing the flow of the Colorado River, “the lifeblood of the Southwest,” by enabling increased evaporation. As the warming continues, increasingly severe water shortages are expected.
Using Drone Imagery to Assess Impacts of the 2018 Carr Fire
USGS WERC’s Dr. Karen Thorne and her research team are using drone imagery to understand how the 2018 Carr Fire affected ecosystems and cultural resources. The study, a collaboration with the National Park Service (NPS), focuses on Whiskeytown National Recreation Area in northern California. The drone images will help the WERC researchers identify changes in topography, cultural sites, debris...
USGS Flood Information
The USGS collects flood data and conducts targeted flood science to help Federal, State, and local agencies, decision makers, and the public before, during, and after a flood. Our efforts provide situational awareness, drive predictive models, inform infrastructure design and operation, undergird floodplain mapping, assist flood constituent/load quantification, and facilitate flood impact...
Storm-Tide Monitoring
It is important to understand how hurricanes and major storms affect coastal areas that are also subject to tidal flows. The only way to do this is to deploy many monitoring sites in the path of these storms, and collect data before, during, and after the storm passes. USGS often deploys this storm-tide monitoring equipment.
Tsunamis and Tsunami Hazards
You don't hear about tsunamis very often, but when they do strike, they can be huge newsmakers and can have drastic and devastating effects. The occurrence and potential for tsunamis on the coasts of the United States is not out of the question. Read on to learn about tsunamis.
The 100-Year Flood
A 100-year flood happened last year so it won't happen for another 99 years, right? Not exactly. Misinterpretation of terminology often leads to confusion about flood recurrence intervals. Read on to learn more.
Post-Fire Flooding and Debris Flow
Fast-moving, highly destructive debris flows triggered by intense rainfall are one of the most dangerous post-fire hazards. The risk of floods and debris flows after fires increases due to vegetation loss and soil exposure. Cases of sudden and deadly debris flow are well documented along the western United States, particularly in Southern California. These flows are a risk to life and property...
National Assessment of Coastal Change Hazards
Research to identify areas that are most vulnerable to coastal change hazards including beach and dune erosion, long-term shoreline change, and sea-level rise.
By
Natural Hazards Mission Area, Coastal and Marine Hazards and Resources Program, Pacific Coastal and Marine Science Center, St. Petersburg Coastal and Marine Science Center, Woods Hole Coastal and Marine Science Center, Gulf of America, Hurricane Harvey, Hurricane Irma, Hurricane Jose, Hurricane Maria, Hurricane Matthew, Hurricane Sandy
Great Salt Lake comparison, 1986 and 2022
These Landsat images show the lake at record high levels in 1986 and at a historic low elevation on July 3, 2022.
These Landsat images show the lake at record high levels in 1986 and at a historic low elevation on July 3, 2022.
USGS streamgage 05430500 Rock River at Afton, WI webcam timelapse (January 2022)
USGS streamgage 05430500 Rock River at Afton, WI webcam timelapse (January 2022)Timelapse of webcam images taken at USGS streamgage 05430500 Rock River at Afton, WI during January 2022. Current webcam imagery for this site is available on the USGS HIVIS website.
USGS streamgage 05430500 Rock River at Afton, WI webcam timelapse (January 2022)
USGS streamgage 05430500 Rock River at Afton, WI webcam timelapse (January 2022)Timelapse of webcam images taken at USGS streamgage 05430500 Rock River at Afton, WI during January 2022. Current webcam imagery for this site is available on the USGS HIVIS website.
USGS responds to busy 2021 Atlantic hurricane Season
USGS responds to busy 2021 Atlantic hurricane SeasonThe 2021 Atlantic hurricane season was the third most-active season on record. The USGS deployed crews and scientists across the country to provide science and resources to emergency managers.
USGS responds to busy 2021 Atlantic hurricane Season
USGS responds to busy 2021 Atlantic hurricane SeasonThe 2021 Atlantic hurricane season was the third most-active season on record. The USGS deployed crews and scientists across the country to provide science and resources to emergency managers.
Lake Powell
This year is the 150th Anniversary of John Wesley Powell’s expedition to explore the Colorado River, a 1,450-mile long waterway that runs through the Western United States and into Mexico.
This year is the 150th Anniversary of John Wesley Powell’s expedition to explore the Colorado River, a 1,450-mile long waterway that runs through the Western United States and into Mexico.
Missouri River Flooding - Landsat
Landsat images from March of 2018 and March of 2019 show a stretch of the Missouri, Platte, and Elkhorn rivers in a full scene that stretches from just north of Sioux City, IA, to south of Omaha, NE. The first image shows the rivers at normal levels.
Landsat images from March of 2018 and March of 2019 show a stretch of the Missouri, Platte, and Elkhorn rivers in a full scene that stretches from just north of Sioux City, IA, to south of Omaha, NE. The first image shows the rivers at normal levels.
Hurricane Ida Water Footprint Data Visualization
Hurricane Ida made landfall as a Category 4 hurricane in Louisiana, and brought widespread precipitation and flooding along its path and up the northeastern coast of U.S. in the following week.
Hurricane Ida made landfall as a Category 4 hurricane in Louisiana, and brought widespread precipitation and flooding along its path and up the northeastern coast of U.S. in the following week.
USGS 21st Century Science - WILDLAND FIRE (portrait)
USGS 21st Century Science - WILDLAND FIRE (portrait)\$71-\$246 BILLION
Net annual economic impact of wildland fire across the U.S.1
650 MILLION
Acres of public lands that are managed for wildland fire.2
16.1 FATALITIES
Average annual fatalities from wildland fire.3
USGS 21st Century Science - WILDLAND FIRE (portrait)
USGS 21st Century Science - WILDLAND FIRE (portrait)\$71-\$246 BILLION
Net annual economic impact of wildland fire across the U.S.1
650 MILLION
Acres of public lands that are managed for wildland fire.2
16.1 FATALITIES
Average annual fatalities from wildland fire.3
Examples of different type of high-water marks
Examples of different type of high-water marks (HWMs) that have the potential to be identified within high-resolution orthophotographs collected using unmanned aircraft systems (sUAS). Panel (A) shows a wash line formed when material is washed down the bank and/or laid over, panel (B) show a mud line depostied by the flood, panel (C) shows a debris line depost
Examples of different type of high-water marks (HWMs) that have the potential to be identified within high-resolution orthophotographs collected using unmanned aircraft systems (sUAS). Panel (A) shows a wash line formed when material is washed down the bank and/or laid over, panel (B) show a mud line depostied by the flood, panel (C) shows a debris line depost
Thermal imaging for fire research
Use of thermal imaging helps researchers to understand the relationship of fuels and fire effects, Valles Caldera National Preserve, New Mexico, 2019.
Use of thermal imaging helps researchers to understand the relationship of fuels and fire effects, Valles Caldera National Preserve, New Mexico, 2019.
USGS Storm Tide Sensors: Measuring Coastal Storm Tide and Flooding
USGS Storm Tide Sensors: Measuring Coastal Storm Tide and FloodingUSGS Storm Tide Sensors are specialized scientific instruments used to measure the depth and duration of storm surge during coastal storms. The data these sensors collect before, during and after a storm will help public officials assess storm damage, and improve computer models used to forecast storm surge and coastal change.
Partners discuss seasonal drought experiments.
Partners discuss seasonal drought experiments.
Partners discuss seasonal drought experiments.
USGS Hurricane Preparedness
Before a hurricane, USGS Scientists undertake a data collection effort of a grand scale. They install a temporary mobile network of sensors along the coasts to collect additional data on the intensity of storm surge, one of the most dangerous elements of a hurricane.
Before a hurricane, USGS Scientists undertake a data collection effort of a grand scale. They install a temporary mobile network of sensors along the coasts to collect additional data on the intensity of storm surge, one of the most dangerous elements of a hurricane.
Taking a High-Water Mark after Hurricane Harvey
USGS scientist Steve Hannes marks high water marks along the Colorado River after flooding from Harvey in Matagorda County, Texas.
USGS scientist Steve Hannes marks high water marks along the Colorado River after flooding from Harvey in Matagorda County, Texas.
USGS Employee Performing Measurement In Record Flood At Gage 7018500
USGS Employee Performing Measurement In Record Flood At Gage 7018500USGS employee Aaron Walsh performing wire weight measurement in record flood at gage 7018500 Big River at Byrnesville, MO
USGS Employee Performing Measurement In Record Flood At Gage 7018500
USGS Employee Performing Measurement In Record Flood At Gage 7018500USGS employee Aaron Walsh performing wire weight measurement in record flood at gage 7018500 Big River at Byrnesville, MO
Las Lomas Debris Flow, January 2017
The June 2016 Fish Fire burned over 12 km^2 in Los Angeles County, California. After the fire, the USGS installed an automated rain-triggered camera to monitor post-wildfire flooding and debris flow in a small canyon above the Las Lomas debris basin in Duarte. This GIF shows part of the peak flow triggered by an intense rainstorm on January 20, 2017.
The June 2016 Fish Fire burned over 12 km^2 in Los Angeles County, California. After the fire, the USGS installed an automated rain-triggered camera to monitor post-wildfire flooding and debris flow in a small canyon above the Las Lomas debris basin in Duarte. This GIF shows part of the peak flow triggered by an intense rainstorm on January 20, 2017.
Storm surge sensor installation prior to Hurricane Irene landfall
Storm surge sensor installation prior to Hurricane Irene landfallStorm surge sensor installation prior to Hurricane Irene landfall
Storm surge sensor installation prior to Hurricane Irene landfall
Storm surge sensor installation prior to Hurricane Irene landfallStorm surge sensor installation prior to Hurricane Irene landfall
Monsoon-Rain Flow in an Ephemeral Channel near Sierra Vista, Arizona
Monsoon-Rain Flow in an Ephemeral Channel near Sierra Vista, ArizonaAs part of the assessment of the binational San Pedro aquifer, the effects of urbanization on runoff in ephemeral streams was studied. Ephemeral streams are those that flow in response to precipitation. Runoff in tributaries to the San Pedro River is important in understanding the water budget of the river.
Satellite image of Hurricane Florence after making landfall in NC
Satellite image of Hurricane Florence after making landfall in NCSatellite image of Hurricane Florence after making landfall in North Carolina. NOAA image.
Satellite image of Hurricane Florence after making landfall in NC
Satellite image of Hurricane Florence after making landfall in NCSatellite image of Hurricane Florence after making landfall in North Carolina. NOAA image.
What are tsunamis? What are tsunamis?
Tsunamis are ocean waves triggered by: Large earthquakes that occur near or under the ocean Volcanic eruptions Submarine landslides Onshore landslides in which large volumes of debris fall into the water Scientists do not use the term "tidal wave" because these waves are not caused by tides. Tsunami waves are unlike typical ocean waves generated by wind and storms, and most tsunamis do not "break"...
When does a drought begin and end? When does a drought begin and end?
The beginning of a drought is difficult to determine. Several weeks, months, or even years might pass before people know that a drought is occurring. The end of a drought can occur as gradually as it began. The first evidence of drought is usually seen in records of rainfall. Within a short period of time, the amount of moisture in soils can begin to decrease. The effects of a drought on flow in...
How are floods predicted? How are floods predicted?
Flood predictions require several types of data: The amount of rainfall occurring on a real-time basis. The rate of change in river stage on a real-time basis, which can help indicate the severity and immediacy of the threat. Knowledge about the type of storm producing the moisture, such as duration, intensity and areal extent, which can be valuable for determining possible severity of the...
Why doesn't a drought end when it rains? Why doesn't a drought end when it rains?
Rainfall in any form will provide some drought relief. A good analogy might be how medicine and illness relate to each other. A single dose of medicine can alleviate symptoms of illness, but it usually takes a sustained program of medication to cure an illness. Likewise, a single rainstorm will not break the drought, but it might provide temporary relief. A light to moderate shower will probably...
What is the role of the USGS in responding to hurricanes? What is the role of the USGS in responding to hurricanes?
The USGS creates detailed maps of our Nation’s shorelines, dunes, and coastal cliffs, and studies how storm processes impact our coastlines. This information is used to predict and map coastal vulnerability to changes caused by major storms, long-term shoreline erosion, sea-level rise, and sea cliff erosion. One example is the USGS Total Water Level and Coastal Change Forecast Viewer, which uses...
How can a 1,000-year rainfall not result in a 1,000-year flood? How can a 1,000-year rainfall not result in a 1,000-year flood?
It comes down to a number of factors, including the pattern of movement of the rainstorm in each particular watershed, the conditions of the soil and plant matter in the watershed, and the timing of the rainstorm in one watershed versus other watersheds. For example, if the ground is already saturated before a rainstorm, much of the rain will run off into streams, but if the ground is dry, it will...
We had a "100-year flood" two years in a row. How can that be? We had a "100-year flood" two years in a row. How can that be?
The term "100-year flood" is used to describe the recurrence interval of floods. The 100-year recurrence interval means that a flood of that magnitude has a one percent chance of occurring in any given year. In other words, the chances that a river will flow as high as the 100-year flood stage this year is 1 in 100. Statistically, each year begins with the same 1-percent chance that a 100-year...
What are the two types of floods? What are the two types of floods?
There are two basic types of floods: flash floods and the more widespread river floods. Flash floods generally cause greater loss of life and river floods generally cause greater loss of property. A flash flood occurs when runoff from excessive rainfall causes a rapid rise in the water height (stage) of a stream or normally-dry channel. Flash floods are more common in areas with a dry climate and...
Can a drought be relieved by bringing in water from other regions of the country that have excess water? Can a drought be relieved by bringing in water from other regions of the country that have excess water?
Any large-scale projects for mitigating drought in the U.S. would fall under the direction of the Bureau of Reclamation, which is the federal agency tasked with water management. While technically feasible, transporting surface water from flood areas (or the ocean) to drought areas faces many challenges including water rights, property rights, environmental impacts, and more. Then there's the...
What should I know about wildfires and debris flows? What should I know about wildfires and debris flows?
Wildland fires are inevitable in the western United States. Expansion of human development into forested areas has created a situation where wildfires can adversely affect lives and property, as can the flooding and landslides that occur in the aftermath of the fires. There is a need to develop tools and methods to identify and quantify the potential hazards posed by landslides produced from...
Could a large tsunami happen in the United States? Could a large tsunami happen in the United States?
Large tsunamis have occurred in the United States and will undoubtedly occur again. Significant earthquakes around the Pacific rim have generated tsunamis that struck Hawaii, Alaska, and the U.S. west coast. One of the largest and most devastating tsunamis that Hawaii has experienced was in 1946 from an earthquake along the Aleutian subduction zone. Runup heights reached a maximum of 33 to 55 feet...
What is a landslide and what causes one? What is a landslide and what causes one?
A landslide is defined as the movement of a mass of rock, debris, or earth down a slope. Landslides are a type of "mass wasting," which denotes any down-slope movement of soil and rock under the direct influence of gravity. The term "landslide" encompasses five modes of slope movement: falls, topples, slides, spreads, and flows. These are further subdivided by the type of geologic material...