


Water is vital to our Nation and the U.S. Geological Survey plays an important role in the tracking and mapping our water resources. The National Hydrography Dataset component of The National Map supports this mission and is widely used in the study of hydrology, natural resources, and pollution control.
Mapping the Water Around Us
Surface water, like rivers and lakes, as well as groundwater have flows that change all the time. The USGS maps and measures water to help understand the environment and how water moves through it. Maps are important tools in understanding water resources, conditions, and issues. Maps allow people to visualize spatial data and understand how the environment may affect their lives.
Mapping Water
Water is vital to our Nation and the U.S. Geological Survey plays an important role in tracking and mapping our water resources. The resources presented below discuss different aspects of mapping our nation's water.
The Benefits of 3D Hydrography
The Benefits of 3D Hydrography
Surveying for flood insurance rate maps
Surveying for flood insurance rate maps
Landsat Water Atlas
Landsat Water Atlas
From Data to Maps
What was your favorite childhood activity? Perhaps playing with or in water?
Though we often take water for granted, it is in fact a precious resource. Water is at the very heart of our existence.
USGS scientists are developing and improving mapping tools to understand water flow and be able to predict future change by monitoring water in different locations and times. They are also interested in areas where there is water shortages, floods, and other water-related hazards. They try to understand what the future may bring by examining the past.
To achieve the goal of predicting water volume, quality, and movement, scientists use tools to measure, analyze, and map water. They use different map types and mapping techniques. An example of this is scientists convert Landsat images to maps to use as tools to measure water use and plan for future needs. The USGS has many other mapping products to help understand water data.
Landsat Science Products
Landsat Science Products
Mobile Water Data
Mobile Water Data
Download Data & Maps from The National Map
Download Data & Maps from The National Map
What is the National Hydrography Program (3DHP)?
What is the National Hydrography Program (3DHP)?
Surface Water Maps
Here are some tools to access USGS Surface Water maps and related data.
3D Hydrography Program
3D Hydrography Program
Federal Priority Streamgages (FPS) Mapper
Federal Priority Streamgages (FPS) Mapper
StreamStats Application
StreamStats Application
Flood Inundation Mapper
Flood Inundation Mapper
USGS Flood Event Viewer
USGS Flood Event Viewer
Mapping Coastal Change
Mapping Coastal Change
Groundwater Maps
Here are some tools to access USGS Groundwater maps and related data.
Principal Aquifers Maps
Principal Aquifers Maps
National Groundwater Monitoring Network
National Groundwater Monitoring Network
U.S. Groundwater Conditions
U.S. Groundwater Conditions
Water Quality Maps
Here are some tools to access USGS Water Quality maps and related data.
National Real-Time Water Quality
National Real-Time Water Quality
Continuous Real-Time Water Quality of Surface Water
Continuous Real-Time Water Quality of Surface Water
SPARROW Watershed Tool
SPARROW Watershed Tool
Water-Quality Changes in the Nation's Streams and Rivers
Water-Quality Changes in the Nation's Streams and Rivers
Groundwater Quality: Decadal Change
Groundwater Quality: Decadal Change
Oil and Gas Water Mapping
Oil and Gas Water Mapping
Water Use Maps
Here are some tools to access USGS Water Use maps and related data.
U.S. Water Use from 1950-2015
U.S. Water Use from 1950-2015
Water use in the U.S., 2015
Water use in the U.S., 2015
Mapping Water Use with Landsat
Mapping Water Use with Landsat
Examples of Mapping Water
Here are examples of projects mapping water around us.
Mapping Florida's Coastal Waters
Mapping Florida's Coastal Waters
Sea Floor Mapping Group
Sea Floor Mapping Group
Delineating the U.S. Extended Continental Shelf
Delineating the U.S. Extended Continental Shelf
Water On-The-Go
Water On-The-Go
Saltwater-Interface Mapping - Long Island
Saltwater-Interface Mapping - Long Island
Mapping Sturgeon Spawning Habitat
Mapping Sturgeon Spawning Habitat
Delineation of Water Bodies In Emergent Wetlands
Delineation of Water Bodies In Emergent Wetlands
Hydraulic Modeling Tool for Stream Crossing Projects in Massachusetts
Hydraulic Modeling Tool for Stream Crossing Projects in Massachusetts
Bridge Scour Countermeasures
Bridge Scour Countermeasures
Predicting Groundwater Quality in Unmonitored Areas
Predicting Groundwater Quality in Unmonitored Areas
Drought Forecasting for Groundwater in Northeastern US
Drought Forecasting for Groundwater in Northeastern US
Science
Flood Inundation Mapping Science
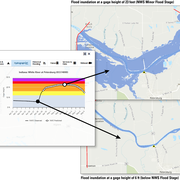
When planning for a flood, there are three key questions that must be answered: What areas will be flooded? How deep will the floodwaters get? When will the flood arrive? A flood inundation map library is a set of maps that together show where flooding may occur – and how deep it may be - over a range of potential flooding scenarios in a stream or river.
Flood Inundation Mapping (FIM) Program
The USGS Flood Inundation Mapping (FIM) Program helps communities protect lives and property by providing tools and information to help them understand their local flood risks and make cost-effective mitigation decisions.

Oil and Gas Waters Project
The Oil and Gas Waters (OGW) project, funded by the Energy Resources Program, aims to provide information on the volume, quality, impacts, and potentially commodity recovery from water co-produced during the generation and development of domestic petroleum resources. The primary goals of this project are to meet the needs of Congress and other stakeholders in the quantification of lithium and...

New Technologies for Mapping Surface Soil Moisture Over Wildfire-Prone Landscapes
A partnership between the USGS, Pepperwood Preserve, and Black Swift LLC aims to map soil and fuel moisture over wildfire-prone landscapes.

StreamStats
StreamStats provides access to spatial analytical tools that are useful for water-resources planning and management, and for engineering and design purposes. The map-based user interface can be used to delineate drainage areas, get basin characteristics and estimates of flow statistics, and more. Available information varies from state to state.
Multimedia

The Role of Hydrography in The National Map
Water is vital to our Nation and the U.S. Geological Survey plays an important role in the tracking and mapping our water resources. The National Hydrography Dataset component of The National Map supports this mission and is widely used in the study of hydrology, natural resources, and pollution control.
Filter Total Items: 13
Flood Inundation Mapping Science
When planning for a flood, there are three key questions that must be answered: What areas will be flooded? How deep will the floodwaters get? When will the flood arrive? A flood inundation map library is a set of maps that together show where flooding may occur – and how deep it may be - over a range of potential flooding scenarios in a stream or river.
Flood Inundation Mapping (FIM) Program
The USGS Flood Inundation Mapping (FIM) Program helps communities protect lives and property by providing tools and information to help them understand their local flood risks and make cost-effective mitigation decisions.
Oil and Gas Waters Project
The Oil and Gas Waters (OGW) project, funded by the Energy Resources Program, aims to provide information on the volume, quality, impacts, and potentially commodity recovery from water co-produced during the generation and development of domestic petroleum resources. The primary goals of this project are to meet the needs of Congress and other stakeholders in the quantification of lithium and...
New Technologies for Mapping Surface Soil Moisture Over Wildfire-Prone Landscapes
A partnership between the USGS, Pepperwood Preserve, and Black Swift LLC aims to map soil and fuel moisture over wildfire-prone landscapes.
StreamStats
StreamStats provides access to spatial analytical tools that are useful for water-resources planning and management, and for engineering and design purposes. The map-based user interface can be used to delineate drainage areas, get basin characteristics and estimates of flow statistics, and more. Available information varies from state to state.

National Water-Quality Assessment (NAWQA)
Our surface water, groundwater, and aquatic ecosystems are priceless resources, used by people across the Nation for drinking, irrigation, industry, and recreation. The National Water-Quality Assessment (NAWQA) Project is a leading source of scientific data and knowledge for development of science-based policies and management strategies to improve and protect our water resources.

Pesticides and Water Quality
Pesticides are chemicals designed to kill pests, including insects (insecticides), weeds (herbicides), and fungi (fungicides). The USGS assesses the occurrence and behavior of pesticides in streams, lakes, and groundwater and the potential for pesticides to contaminate our drinking-water supplies or harm aquatic ecosystems.

USGS Flood Inundation Mapping Science
Through local partnerships the USGS Flood Inundation Mapping (FIM) Program helps communities protect lives and property by providing tools and information to help them understand their local flood risks and make cost-effective mitigation decisions. Click for more information on this USGS program.

SPARROW: Attributes for NHDPlus Catchments (Version 1.1) for the Conterminous United States
The national databases used in USGS SPARROW models are available for download. Attributes from the NHDPlus data set, such as climate, geology, soils, land cover, hydrologic variables, physical characteristics, chemicals, and nutrients, are available for all catchments in the digital stream networks (1:500K scale).

Mapping and Characterizing the Arsenic Hazard in Private Well Water Across the Nation
Study estimates about 2.1 million people using wells high in arsenic: USGS research directly supports federal agencies concerned with public health—specifically, understanding natural hazards in private domestic drinking water and the risk they pose to human health.

The National Hydrography Dataset (NHD)
The National Hydrography Dataset (NHD) represents surface waters of the United States including, rivers, streams, lakes, and coastal features. The Watershed Boundary Dataset (WBD) is comprised of hierarchical polygons called hydrologic units that represent surface area over which water drains to a point. Both datasets are updated by stewards and are available by subsets of the United States.

Development of a Graphical User Interface (GUI) to Predict Streamflow Statistics using USGS Streamstats and Precipitation from Downscaled Global Climate Change Models
Background Climate change during the past century has resulted in changes to precipitation amounts, form (rain vs. snow), as well as frequency and intensity in the northeastern US (Huntington et al., 2009). Additional changes in precipitation are forecast for the 21st Century as the global and regional climate is expected to warm substantially (Hayhoe et al., 2007). These ongoing and...
The Role of Hydrography in The National Map
Water is vital to our Nation and the U.S. Geological Survey plays an important role in the tracking and mapping our water resources. The National Hydrography Dataset component of The National Map supports this mission and is widely used in the study of hydrology, natural resources, and pollution control.
Water is vital to our Nation and the U.S. Geological Survey plays an important role in the tracking and mapping our water resources. The National Hydrography Dataset component of The National Map supports this mission and is widely used in the study of hydrology, natural resources, and pollution control.

Where can I get watershed maps? Where can I get watershed maps?
Use The National Map Viewer to display or create watershed maps with the National Watershed Boundary Dataset. Watersheds are shown as Hydrologic Units, each one with a unique Hydrologic Unit Code (HUC). Go to The National Map Viewer (it might take a minute to fully load). In the green bar above the map, click on the Layers icon, which looks like a stack of paper. Click on the box beside "Watershed...

Where can I find flood maps? Where can I find flood maps?
FEMA is the official public source for flood maps for insurance purposes: FEMA’s Flood Map Service Center FEMA’s National Flood Hazard Layer NOAA is responsible for producing flood forecast maps that combine precipitation data with USGS streamflow data: NWS - National Water Prediction Service: River forecasts and long range flood outlook Coastal Inundation Dashboard: Real-time and historical...

Where in the Nation are droughts or very low flows occurring now? How can I see these sites on a map and get to the data? Where in the Nation are droughts or very low flows occurring now? How can I see these sites on a map and get to the data?
To view the USGS streamflow information on drought, see the drought map on our WaterWatch site, which shows below-normal, 7-day average streamflow compared to historical streamflow for the United States. Links to additional maps and drought data are listed on the USGS Drought website and the National Integrated Drought Information System (NIDIS).

What is the Ground Water Atlas of the United States? What is the Ground Water Atlas of the United States?
This Ground Water Atlas of the United States is a series of USGS publications that describe the location, the extent, and the geologic and hydrologic characteristics of the important aquifers of the Nation. The series consists of 13 chapters that describe the regional groundwater resources that collectively cover 50 States, Puerto Rico, and the U.S. Virgin Islands. Learn more: Principal Aquifers...

How do I download hydrography data products? How do I download hydrography data products?
Download USGS hydrography data (datasets representing U.S. surface water for mapping and modeling applications) using The National Map Downloader or using download links that are listed at Access National Hydrography Products. Learn more: The National Map: Hydrography Training Videos National Hydrography Dataset User Guide For streamflow data, see: Where can I get real-time and historical...
Surface water, like rivers and lakes, as well as groundwater have flows that change all the time. The USGS maps and measures water to help understand the environment and how water moves through it. Maps are important tools in understanding water resources, conditions, and issues. Maps allow people to visualize spatial data and understand how the environment may affect their lives.
Mapping Water
Water is vital to our Nation and the U.S. Geological Survey plays an important role in tracking and mapping our water resources. The resources presented below discuss different aspects of mapping our nation's water.
The Benefits of 3D Hydrography
The Benefits of 3D Hydrography
Surveying for flood insurance rate maps
Surveying for flood insurance rate maps
Landsat Water Atlas
Landsat Water Atlas
From Data to Maps
What was your favorite childhood activity? Perhaps playing with or in water?
Though we often take water for granted, it is in fact a precious resource. Water is at the very heart of our existence.
USGS scientists are developing and improving mapping tools to understand water flow and be able to predict future change by monitoring water in different locations and times. They are also interested in areas where there is water shortages, floods, and other water-related hazards. They try to understand what the future may bring by examining the past.
To achieve the goal of predicting water volume, quality, and movement, scientists use tools to measure, analyze, and map water. They use different map types and mapping techniques. An example of this is scientists convert Landsat images to maps to use as tools to measure water use and plan for future needs. The USGS has many other mapping products to help understand water data.
Landsat Science Products
Landsat Science Products
Mobile Water Data
Mobile Water Data
Download Data & Maps from The National Map
Download Data & Maps from The National Map
What is the National Hydrography Program (3DHP)?
What is the National Hydrography Program (3DHP)?
Surface Water Maps
Here are some tools to access USGS Surface Water maps and related data.
3D Hydrography Program
3D Hydrography Program
Federal Priority Streamgages (FPS) Mapper
Federal Priority Streamgages (FPS) Mapper
StreamStats Application
StreamStats Application
Flood Inundation Mapper
Flood Inundation Mapper
USGS Flood Event Viewer
USGS Flood Event Viewer
Mapping Coastal Change
Mapping Coastal Change
Groundwater Maps
Here are some tools to access USGS Groundwater maps and related data.
Principal Aquifers Maps
Principal Aquifers Maps
National Groundwater Monitoring Network
National Groundwater Monitoring Network
U.S. Groundwater Conditions
U.S. Groundwater Conditions
Water Quality Maps
Here are some tools to access USGS Water Quality maps and related data.
National Real-Time Water Quality
National Real-Time Water Quality
Continuous Real-Time Water Quality of Surface Water
Continuous Real-Time Water Quality of Surface Water
SPARROW Watershed Tool
SPARROW Watershed Tool
Water-Quality Changes in the Nation's Streams and Rivers
Water-Quality Changes in the Nation's Streams and Rivers
Groundwater Quality: Decadal Change
Groundwater Quality: Decadal Change
Oil and Gas Water Mapping
Oil and Gas Water Mapping
Water Use Maps
Here are some tools to access USGS Water Use maps and related data.
U.S. Water Use from 1950-2015
U.S. Water Use from 1950-2015
Water use in the U.S., 2015
Water use in the U.S., 2015
Mapping Water Use with Landsat
Mapping Water Use with Landsat
Examples of Mapping Water
Here are examples of projects mapping water around us.
Mapping Florida's Coastal Waters
Mapping Florida's Coastal Waters
Sea Floor Mapping Group
Sea Floor Mapping Group
Delineating the U.S. Extended Continental Shelf
Delineating the U.S. Extended Continental Shelf
Water On-The-Go
Water On-The-Go
Saltwater-Interface Mapping - Long Island
Saltwater-Interface Mapping - Long Island
Mapping Sturgeon Spawning Habitat
Mapping Sturgeon Spawning Habitat
Delineation of Water Bodies In Emergent Wetlands
Delineation of Water Bodies In Emergent Wetlands
Hydraulic Modeling Tool for Stream Crossing Projects in Massachusetts
Hydraulic Modeling Tool for Stream Crossing Projects in Massachusetts
Bridge Scour Countermeasures
Bridge Scour Countermeasures
Predicting Groundwater Quality in Unmonitored Areas
Predicting Groundwater Quality in Unmonitored Areas
Drought Forecasting for Groundwater in Northeastern US
Drought Forecasting for Groundwater in Northeastern US
Science
Flood Inundation Mapping Science
When planning for a flood, there are three key questions that must be answered: What areas will be flooded? How deep will the floodwaters get? When will the flood arrive? A flood inundation map library is a set of maps that together show where flooding may occur – and how deep it may be - over a range of potential flooding scenarios in a stream or river.
Flood Inundation Mapping (FIM) Program
The USGS Flood Inundation Mapping (FIM) Program helps communities protect lives and property by providing tools and information to help them understand their local flood risks and make cost-effective mitigation decisions.
Oil and Gas Waters Project
The Oil and Gas Waters (OGW) project, funded by the Energy Resources Program, aims to provide information on the volume, quality, impacts, and potentially commodity recovery from water co-produced during the generation and development of domestic petroleum resources. The primary goals of this project are to meet the needs of Congress and other stakeholders in the quantification of lithium and...
New Technologies for Mapping Surface Soil Moisture Over Wildfire-Prone Landscapes
A partnership between the USGS, Pepperwood Preserve, and Black Swift LLC aims to map soil and fuel moisture over wildfire-prone landscapes.
StreamStats
StreamStats provides access to spatial analytical tools that are useful for water-resources planning and management, and for engineering and design purposes. The map-based user interface can be used to delineate drainage areas, get basin characteristics and estimates of flow statistics, and more. Available information varies from state to state.
Multimedia
The Role of Hydrography in The National Map
Water is vital to our Nation and the U.S. Geological Survey plays an important role in the tracking and mapping our water resources. The National Hydrography Dataset component of The National Map supports this mission and is widely used in the study of hydrology, natural resources, and pollution control.
Water is vital to our Nation and the U.S. Geological Survey plays an important role in the tracking and mapping our water resources. The National Hydrography Dataset component of The National Map supports this mission and is widely used in the study of hydrology, natural resources, and pollution control.
Filter Total Items: 13
Flood Inundation Mapping Science
When planning for a flood, there are three key questions that must be answered: What areas will be flooded? How deep will the floodwaters get? When will the flood arrive? A flood inundation map library is a set of maps that together show where flooding may occur – and how deep it may be - over a range of potential flooding scenarios in a stream or river.
Flood Inundation Mapping (FIM) Program
The USGS Flood Inundation Mapping (FIM) Program helps communities protect lives and property by providing tools and information to help them understand their local flood risks and make cost-effective mitigation decisions.
Oil and Gas Waters Project
The Oil and Gas Waters (OGW) project, funded by the Energy Resources Program, aims to provide information on the volume, quality, impacts, and potentially commodity recovery from water co-produced during the generation and development of domestic petroleum resources. The primary goals of this project are to meet the needs of Congress and other stakeholders in the quantification of lithium and...
New Technologies for Mapping Surface Soil Moisture Over Wildfire-Prone Landscapes
A partnership between the USGS, Pepperwood Preserve, and Black Swift LLC aims to map soil and fuel moisture over wildfire-prone landscapes.
StreamStats
StreamStats provides access to spatial analytical tools that are useful for water-resources planning and management, and for engineering and design purposes. The map-based user interface can be used to delineate drainage areas, get basin characteristics and estimates of flow statistics, and more. Available information varies from state to state.
National Water-Quality Assessment (NAWQA)
Our surface water, groundwater, and aquatic ecosystems are priceless resources, used by people across the Nation for drinking, irrigation, industry, and recreation. The National Water-Quality Assessment (NAWQA) Project is a leading source of scientific data and knowledge for development of science-based policies and management strategies to improve and protect our water resources.
Pesticides and Water Quality
Pesticides are chemicals designed to kill pests, including insects (insecticides), weeds (herbicides), and fungi (fungicides). The USGS assesses the occurrence and behavior of pesticides in streams, lakes, and groundwater and the potential for pesticides to contaminate our drinking-water supplies or harm aquatic ecosystems.
USGS Flood Inundation Mapping Science
Through local partnerships the USGS Flood Inundation Mapping (FIM) Program helps communities protect lives and property by providing tools and information to help them understand their local flood risks and make cost-effective mitigation decisions. Click for more information on this USGS program.
SPARROW: Attributes for NHDPlus Catchments (Version 1.1) for the Conterminous United States
The national databases used in USGS SPARROW models are available for download. Attributes from the NHDPlus data set, such as climate, geology, soils, land cover, hydrologic variables, physical characteristics, chemicals, and nutrients, are available for all catchments in the digital stream networks (1:500K scale).
Mapping and Characterizing the Arsenic Hazard in Private Well Water Across the Nation
Study estimates about 2.1 million people using wells high in arsenic: USGS research directly supports federal agencies concerned with public health—specifically, understanding natural hazards in private domestic drinking water and the risk they pose to human health.
The National Hydrography Dataset (NHD)
The National Hydrography Dataset (NHD) represents surface waters of the United States including, rivers, streams, lakes, and coastal features. The Watershed Boundary Dataset (WBD) is comprised of hierarchical polygons called hydrologic units that represent surface area over which water drains to a point. Both datasets are updated by stewards and are available by subsets of the United States.
Development of a Graphical User Interface (GUI) to Predict Streamflow Statistics using USGS Streamstats and Precipitation from Downscaled Global Climate Change Models
Background Climate change during the past century has resulted in changes to precipitation amounts, form (rain vs. snow), as well as frequency and intensity in the northeastern US (Huntington et al., 2009). Additional changes in precipitation are forecast for the 21st Century as the global and regional climate is expected to warm substantially (Hayhoe et al., 2007). These ongoing and...
The Role of Hydrography in The National Map
Water is vital to our Nation and the U.S. Geological Survey plays an important role in the tracking and mapping our water resources. The National Hydrography Dataset component of The National Map supports this mission and is widely used in the study of hydrology, natural resources, and pollution control.
Water is vital to our Nation and the U.S. Geological Survey plays an important role in the tracking and mapping our water resources. The National Hydrography Dataset component of The National Map supports this mission and is widely used in the study of hydrology, natural resources, and pollution control.
Where can I get watershed maps? Where can I get watershed maps?
Use The National Map Viewer to display or create watershed maps with the National Watershed Boundary Dataset. Watersheds are shown as Hydrologic Units, each one with a unique Hydrologic Unit Code (HUC). Go to The National Map Viewer (it might take a minute to fully load). In the green bar above the map, click on the Layers icon, which looks like a stack of paper. Click on the box beside "Watershed...
Where can I find flood maps? Where can I find flood maps?
FEMA is the official public source for flood maps for insurance purposes: FEMA’s Flood Map Service Center FEMA’s National Flood Hazard Layer NOAA is responsible for producing flood forecast maps that combine precipitation data with USGS streamflow data: NWS - National Water Prediction Service: River forecasts and long range flood outlook Coastal Inundation Dashboard: Real-time and historical...
Where in the Nation are droughts or very low flows occurring now? How can I see these sites on a map and get to the data? Where in the Nation are droughts or very low flows occurring now? How can I see these sites on a map and get to the data?
To view the USGS streamflow information on drought, see the drought map on our WaterWatch site, which shows below-normal, 7-day average streamflow compared to historical streamflow for the United States. Links to additional maps and drought data are listed on the USGS Drought website and the National Integrated Drought Information System (NIDIS).
What is the Ground Water Atlas of the United States? What is the Ground Water Atlas of the United States?
This Ground Water Atlas of the United States is a series of USGS publications that describe the location, the extent, and the geologic and hydrologic characteristics of the important aquifers of the Nation. The series consists of 13 chapters that describe the regional groundwater resources that collectively cover 50 States, Puerto Rico, and the U.S. Virgin Islands. Learn more: Principal Aquifers...
How do I download hydrography data products? How do I download hydrography data products?
Download USGS hydrography data (datasets representing U.S. surface water for mapping and modeling applications) using The National Map Downloader or using download links that are listed at Access National Hydrography Products. Learn more: The National Map: Hydrography Training Videos National Hydrography Dataset User Guide For streamflow data, see: Where can I get real-time and historical...